D2C Playbook 7 -- Marketing Mix Modeling (MMM)

The short version
Incrementality testing told you whether one channel was real. You turned Meta off in a few cities and read the gap. But you can only test one channel at a time, and you can't turn off the ones that matter most for a growing brand: your influencer deals, your brand campaigns, the quick-commerce ad spend you can't cleanly isolate, offline.
Marketing mix modeling is how you divide a whole budget across every channel at once, including the ones you can't turn off. It takes two years of weekly spend and revenue, and it splits your sales into named pieces: this much was base, this much was Meta, this much was Google, this much was quick-commerce.
Here is the thing most vendor decks won't tell you. MMM is a model, not a measurement. It doesn't observe what each channel did. It infers it from how spend and sales moved together over time. Feed it two years of spend that only ever went up, and it will confidently hand you numbers that are wrong.
- MMM needs no cookies and no user-level tracking. It works on quick-commerce and TV where you have zero user data.
- Its biggest single component is usually base: the sales that would have happened with no ad spend at all.
- It is a correlation engine by default. The one thing that turns it into something closer to causation is calibrating it against the geo tests from the last playbook.
MMM is only as honest as the variation you fed it. This playbook shows you what goes in, what comes out, and where it lies.
What does MMM look like on a real brand?
Same skincare brand from the incrementality playbook. Roughly ₹2 crore a month in revenue, spending across four channels. In the last playbook their geo test revealed Meta's real incremental ROAS was 1.7x, not the 4.0x the dashboard claimed. Now they want to know how to split the entire budget, not just judge one channel.
MMM answers that. Here is what it actually looks like, end to end.
What data does MMM need?
MMM does not want user data. It wants a spreadsheet. One row per week, going back about two years, with a column for each channel's spend, a column for revenue, and a few columns for context like whether it was a festive period.
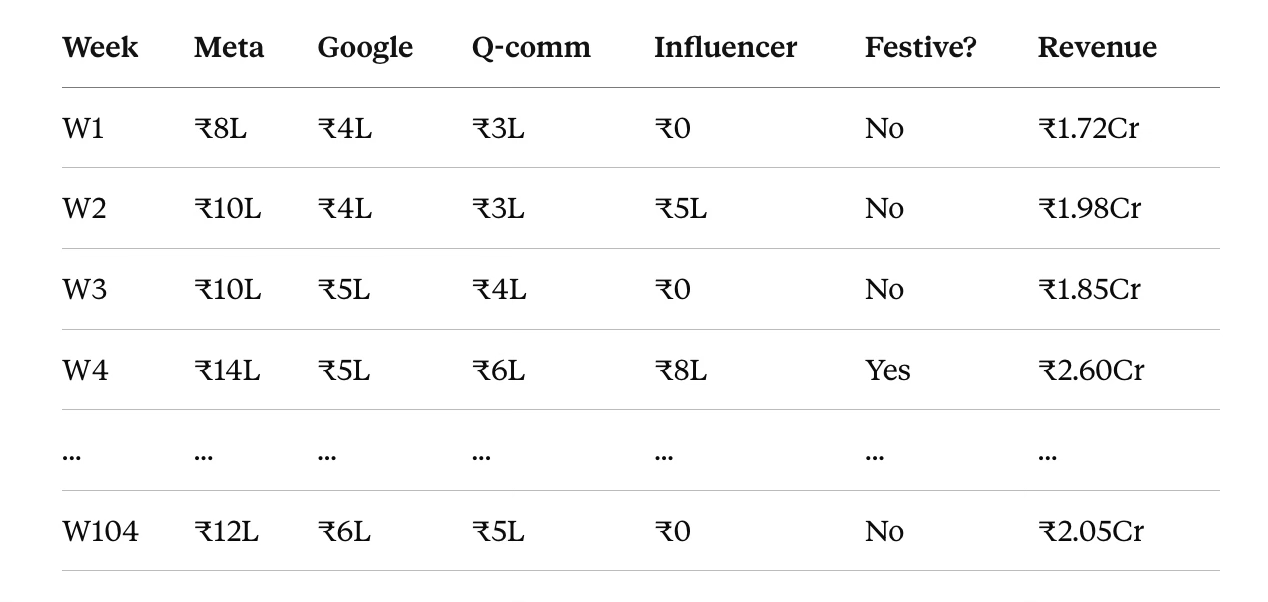
That is the whole input. Notice what is not here: no user IDs, no cookies, no attribution windows. This is why MMM survives iOS privacy changes and works on channels where you never see a single customer. Your quick-commerce spend and your TV spend sit in the same table as Meta, treated identically.
The catch is in the columns, not the rows. For the model to learn what Meta did, Meta spend has to actually move around across those weeks. A channel you spent the same ₹10L on every single week tells the model nothing. More on that later, because it is the thing that quietly breaks most models.
What does MMM give you back?
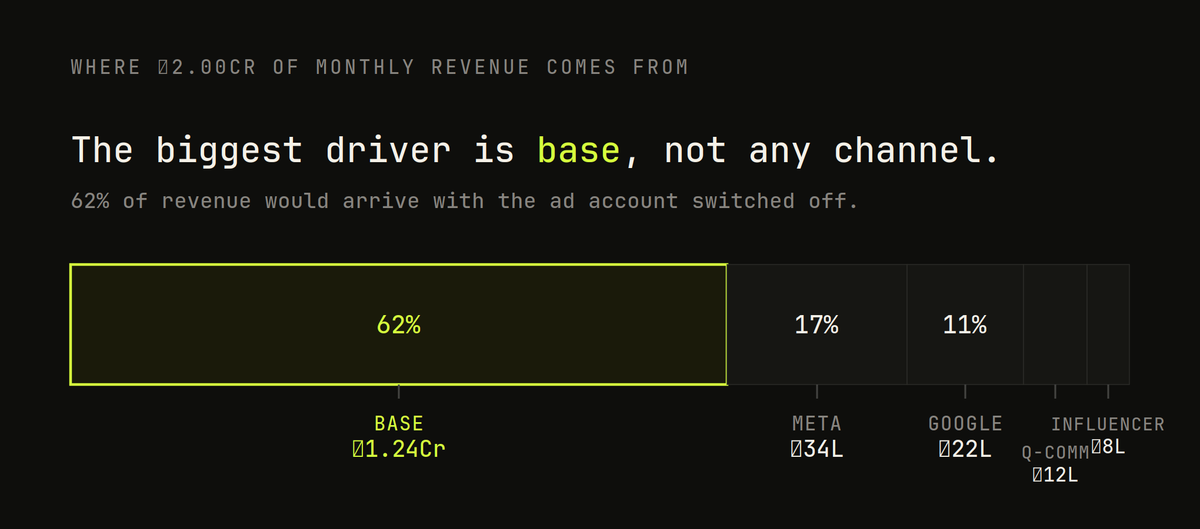
The model reads that history and does something attribution never can. It splits a period's revenue into named contributions.
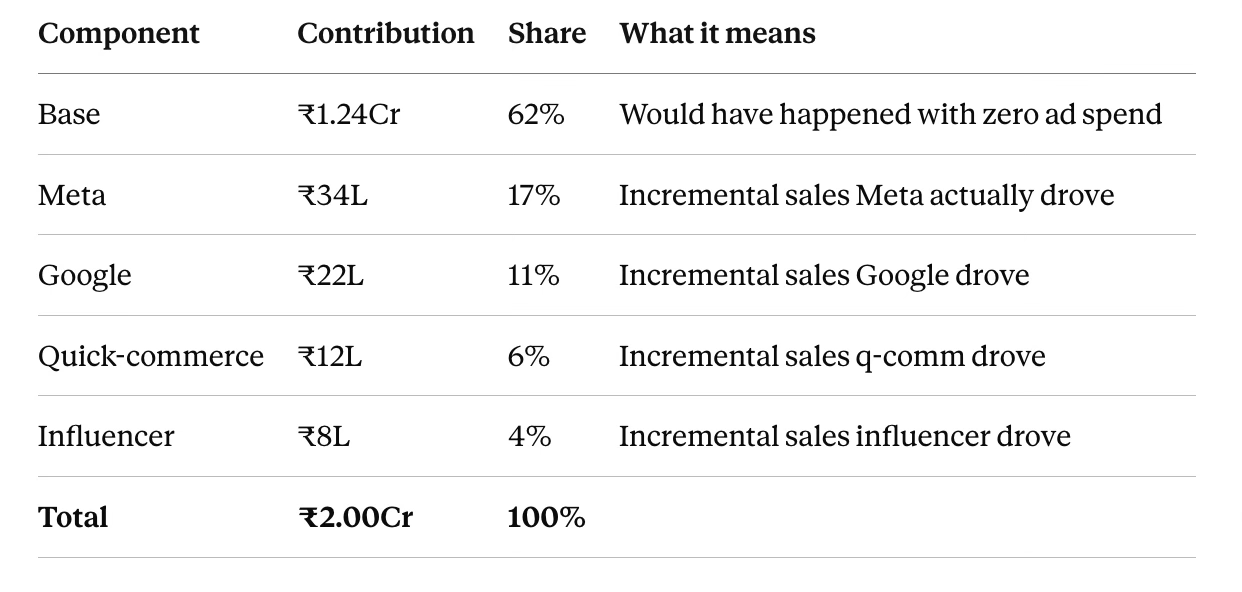
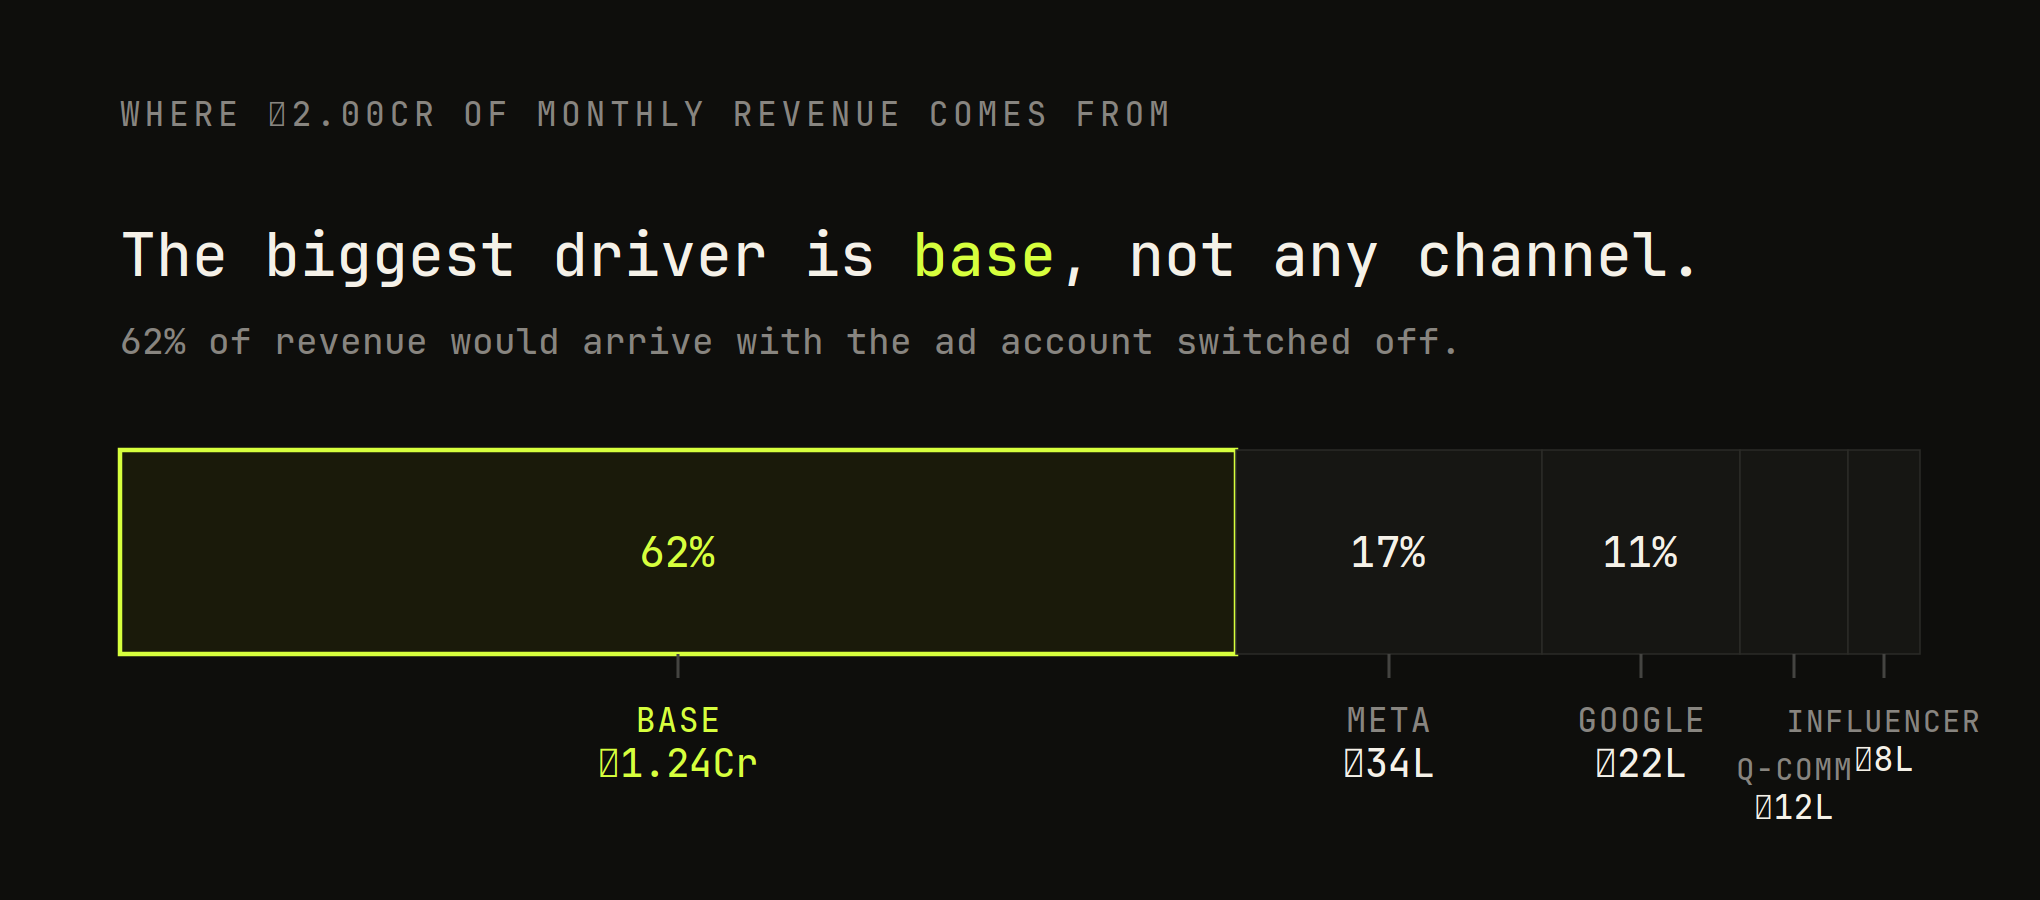
Look at the top row. The single largest driver of this brand's revenue is not any channel. It is base: repeat buyers, organic traffic, people who searched the brand name because they already knew it. Nearly two thirds of revenue would have shown up with the ad account switched off.
This is the number attribution can never give you, and it is the reason platform ROAS is inflated. When Meta reports it drove ₹40L, a large part of that was base revenue that happened to pass through a Meta ad on the way to a checkout that was coming anyway. MMM's first job is to fence off the base so no channel gets credit for it.
What do you actually do with the output?
The decomposition is interesting. This next table is the one you act on. For each channel, put its spend next to its contribution, work out the marginal return, and decide.
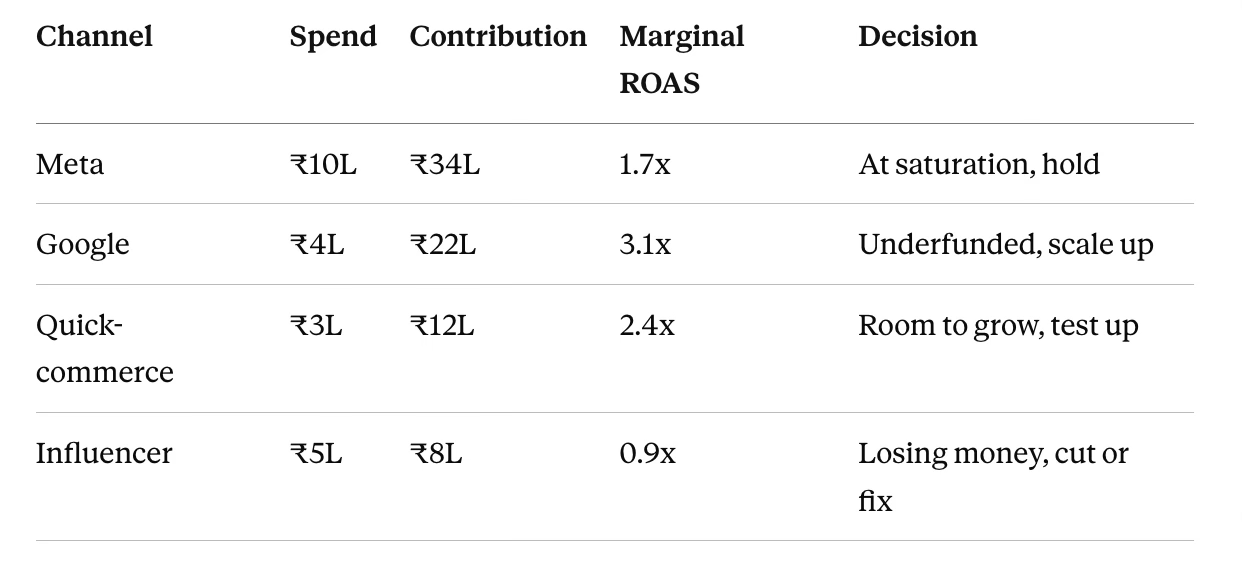
Two things to read here.
First, Meta's marginal ROAS is 1.7x, the exact number the geo test found last playbook. That is not a coincidence in this example, and later I will show you why it should not be a coincidence in real life either.
Second, and this is the trap most founders fall into: marginal ROAS is not average ROAS. Meta's average return across all its spend might look fine. But the question for your next rupee is what the next rupee earns, not what the average one did. Meta is at 1.7x on the margin, which at a 60% contribution margin is barely breaking even. Google is sitting at 3.1x and starved of budget. The move is obvious once you see it, and invisible on any platform dashboard.
What is base versus incremental revenue?
Everything above hangs on one distinction, so it is worth slowing down on it.
Your revenue has two parts. There is the part that happens no matter what you spend, and the part your spending actually caused.
- Base is your floor. Repeat customers, organic search, direct traffic, word of mouth, the demand your brand has already built. If you paused every ad tomorrow, base is roughly what you would still do next week.
- Incremental is the lift on top. The sales that only happened because an ad ran.
This is the same question the incrementality playbook asked, "would this sale have happened anyway," just asked about your entire business at once instead of one channel in a few cities.
Why it matters so much: base revenue does not sit still waiting to be counted. It flows through your ads. Someone who was always going to reorder your moisturiser sees a retargeting ad first, clicks it, buys. Meta counts that sale. Attribution counts that sale. Both are wrong about why it happened.
For a brand with real repeat purchase and brand recognition, base can be well over half of revenue. Every rupee of that base that gets miscredited to a channel makes that channel look better than it is, and pulls budget toward spend that was never doing the work. Sizing the base correctly is most of the value of MMM. The channel splits are almost a byproduct.
Which two curves does MMM care about?
MMM does not treat spend as a straight line. If it did, you would not need a model, you would need a calculator. Two effects bend the line, and understanding their shape is where the budget decisions actually come from.
Adstock: why does today's spend sell for days?
An ad you run today does not only sell today. Someone sees it Monday, thinks about it, buys Thursday. Spend has a tail.
MMM models this with adstock, also called carryover. The idea in one line:
effect this week = spend this week + (decay × effect last week)
The decay rate says how long the tail is. A high decay means the effect lingers for weeks, which is typical of brand and video. A low decay means it is gone almost immediately, typical of a discount code. Get this wrong and you either credit this week's sales to last week's spend or miss the lag entirely.
Saturation: why isn't the tenth lakh worth the same as the first?
Your first ₹1L on Meta finds the people most likely to buy. Your tenth ₹1L is chasing people who need a lot more convincing. Returns diminish. Every channel has a point where pouring in more money stops working.
MMM models this with a saturation curve, an S-shaped response where spend stops converting linearly and starts flattening:
sales from a channel = contribution × ( spend^n / (spend^n + K^n) )
You do not need to love that formula. You need what it produces: a curve that tells you where you are on it.
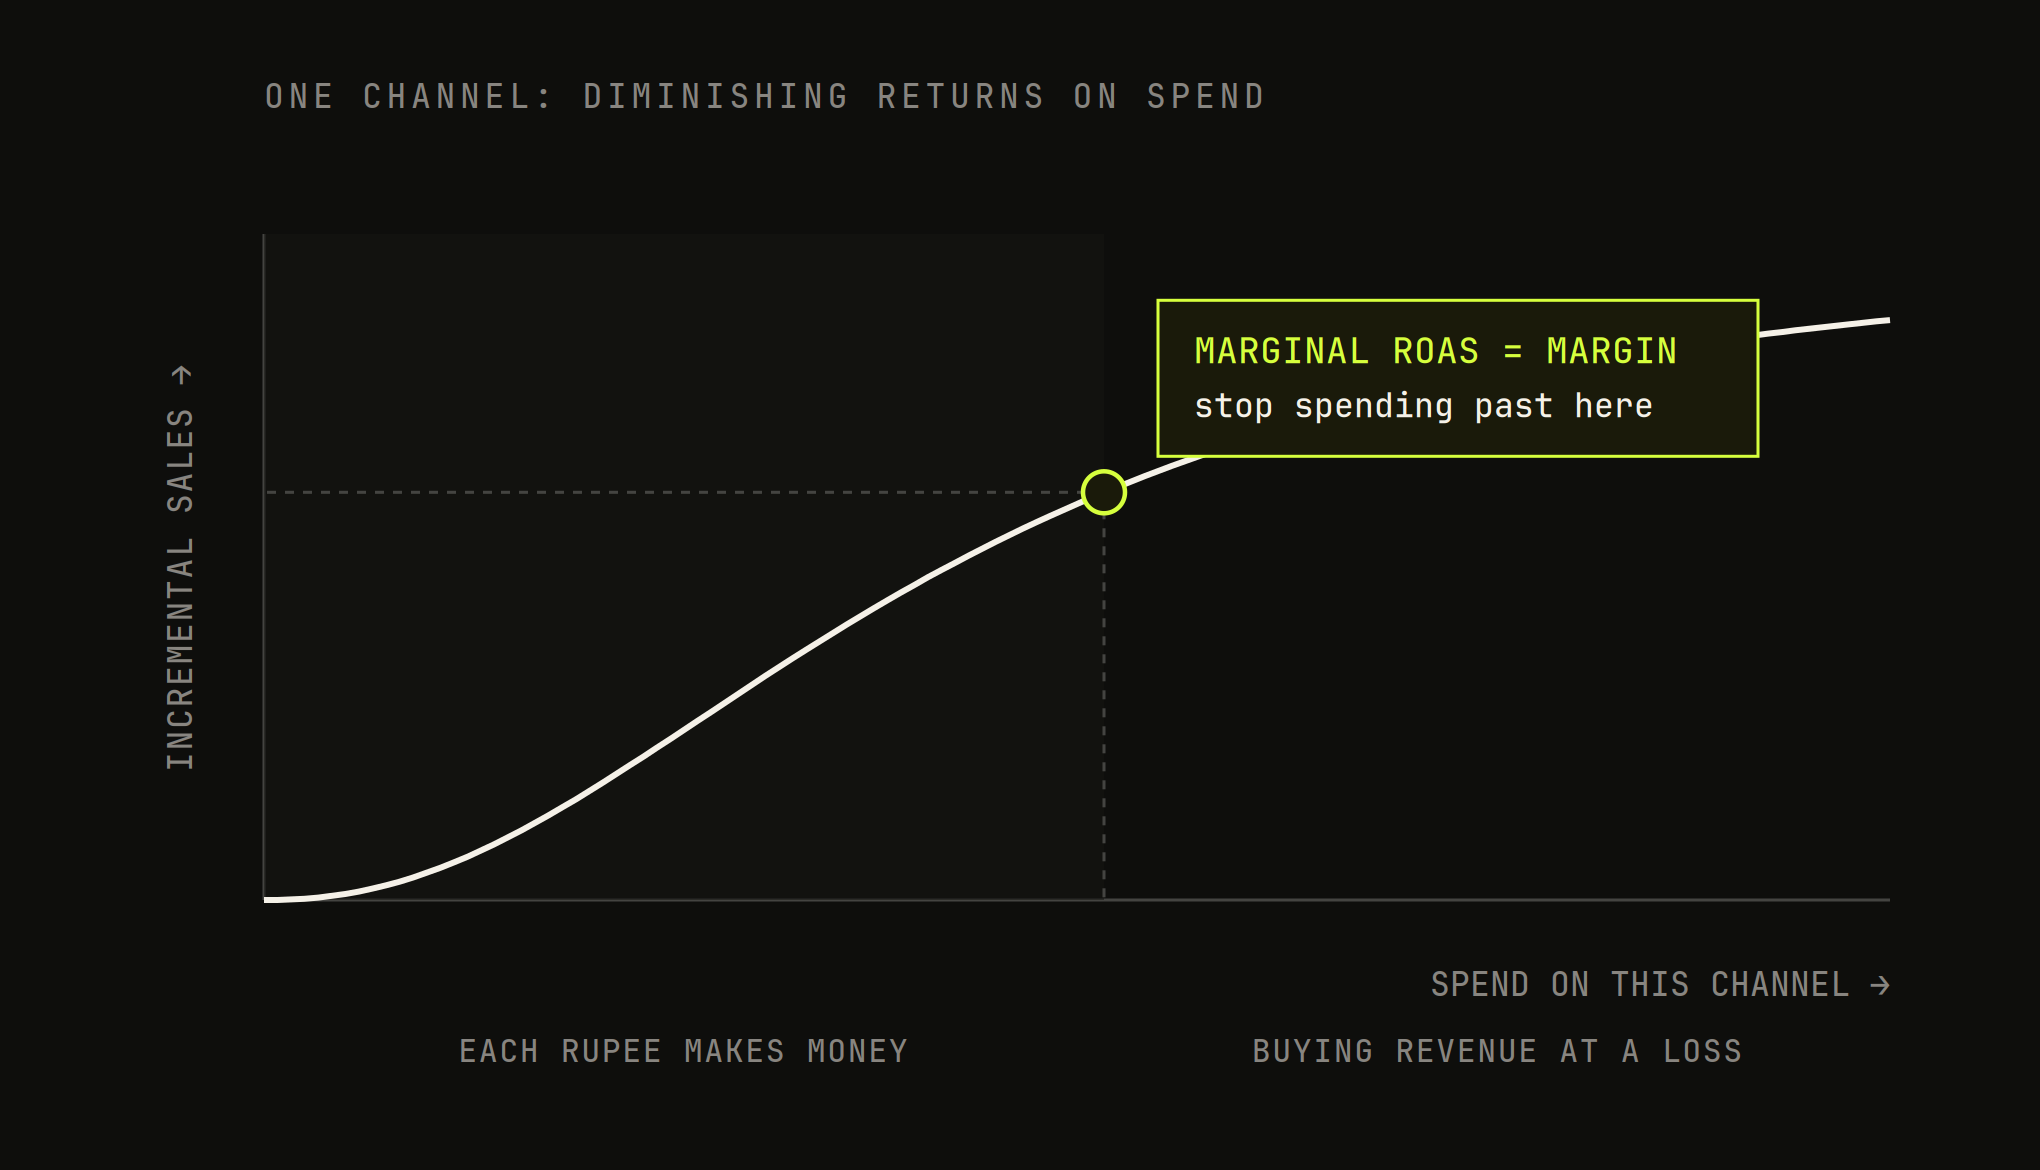
The whole game is finding where your marginal return crosses your margin. Spend up to that point and the next rupee makes money. Spend past it and you are buying revenue for more than it is worth. In the table earlier, Meta was past that point and Google was well short of it. The saturation curve is what let the model see that.
Put the two curves together and you have why MMM exists. It is not splitting a pie. It is figuring out the shape of each channel's response so it can tell you where the next rupee should go.
Where does MMM lie?
This is the section the vendor selling you MMM will skip. MMM produces a clean, confident, beautifully visualised answer, and that answer can be completely wrong. Here is how.
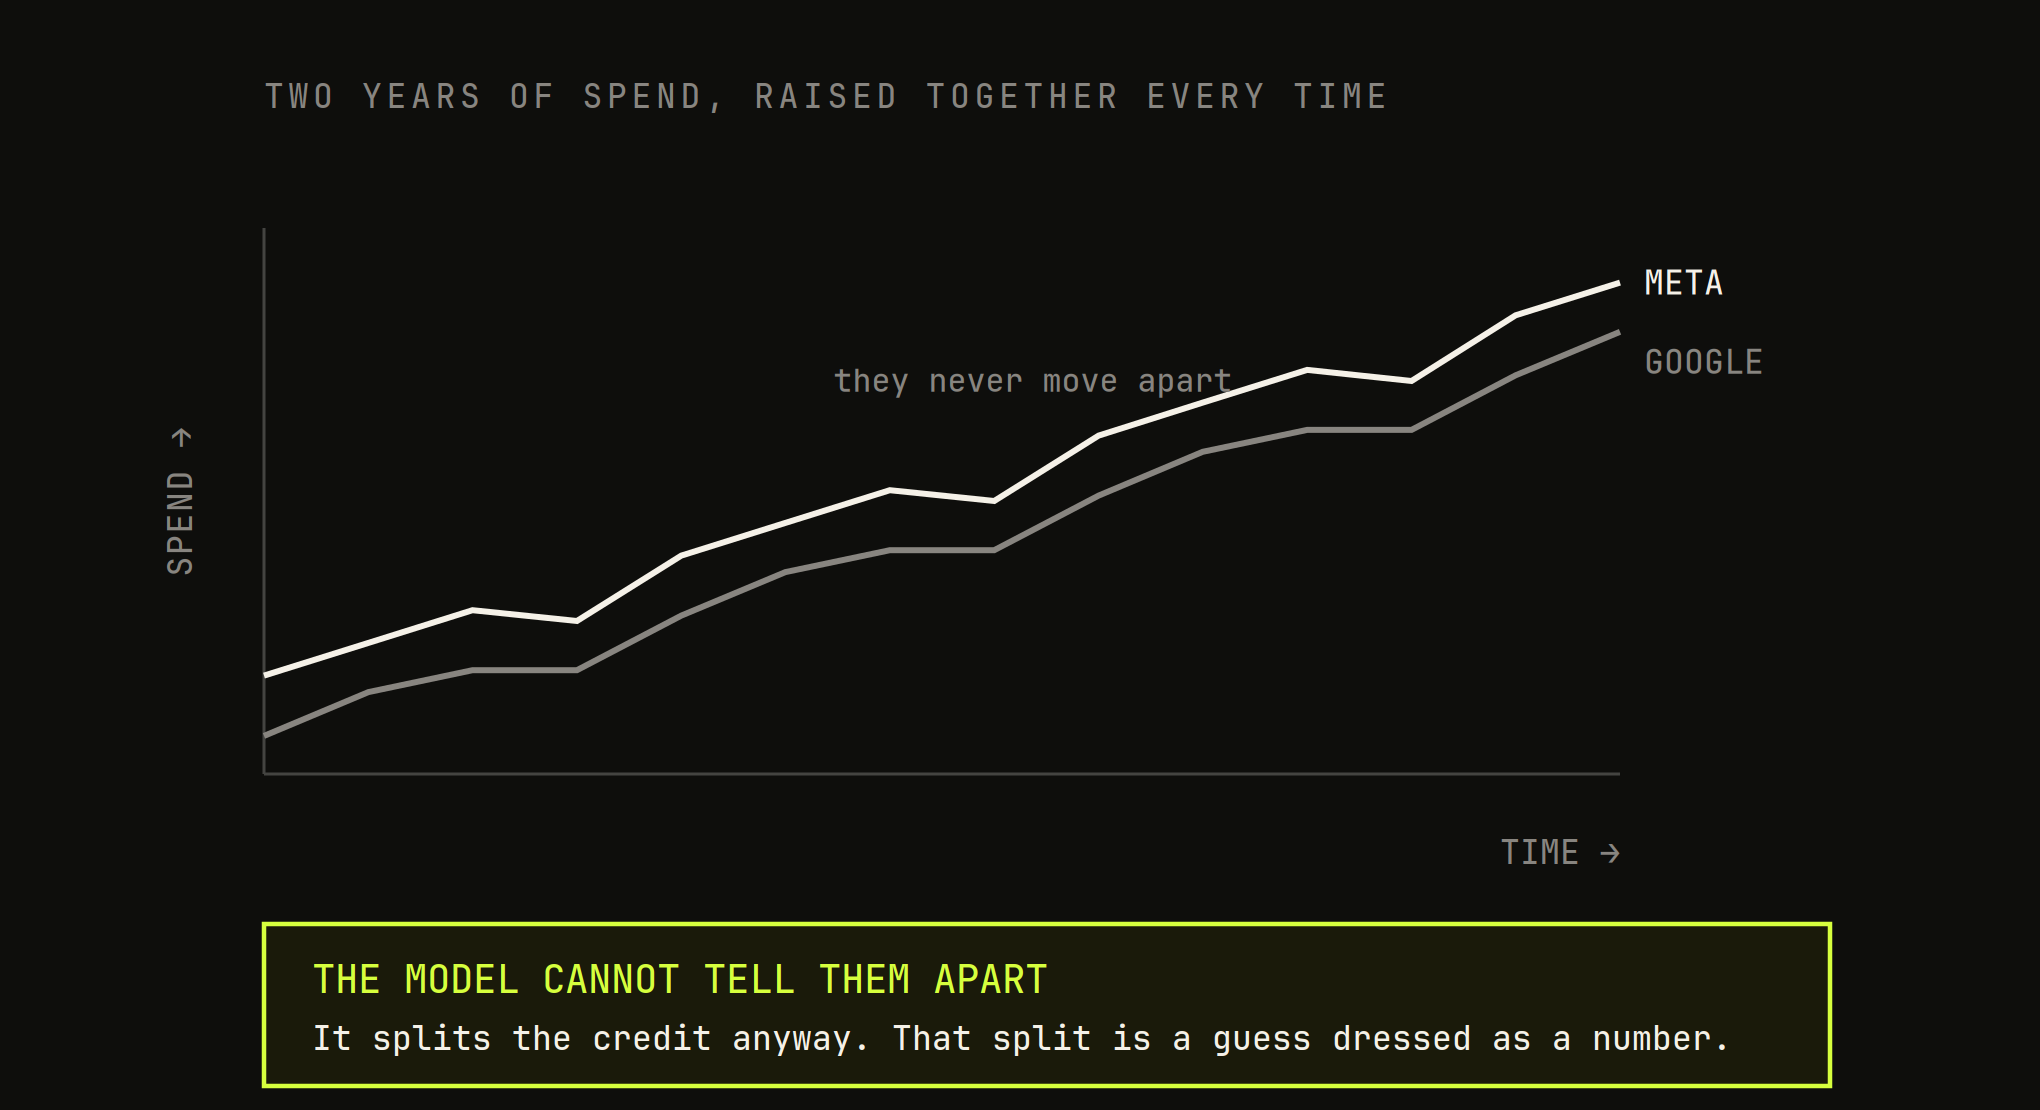
It cannot separate channels that move together. This is the big one. If you raise Meta and Google budgets at the same time, every time, for two years, the model has no way to tell their effects apart. It sees both went up when sales went up. It will split the credit, but the split is a guess dressed as a number. In the industry this is called collinearity, and it is the single most common reason an MMM is quietly useless.
A channel you never varied is invisible. If Meta spend was a flat ₹10L every week, the model cannot learn what Meta does, because nothing ever changed to observe. Counterintuitively, the more disciplined and steady your spending, the less an MMM can learn from it. Models are built on variation.
Not enough history, or the wrong kind. People say MMM needs two years of data. What they mean is that two years usually contains enough variation and enough seasonal cycles to learn from. But the calendar is not the point. Three years of flat spend teaches the model less than nine months where you meaningfully shifted budget around. The real requirement is roughly ten weeks of data for every channel you want to measure, with real movement in each. Eight channels means you want well over a year of genuinely varied history, not just a long one.
Correlation is not causation, and the model only knows correlation. If you always spend more in December and you also always sell more in December, the model may hand the credit to your ads when the real driver was the season. MMM tries to control for this with festive flags and trend terms, but it is inference, not proof. The model can be confidently, plausibly wrong.
None of this makes MMM useless. It makes an uncalibrated MMM a very expensive way to confirm what you already believed. Which brings us to the fix.
Why must you calibrate MMM against a real test?
Left alone, MMM is a correlation engine. It watches spend and sales move together and infers the rest. That inference is exactly where collinearity and seasonality poison the result.
The fix is the whole reason the last playbook came first. You already have causal ground truth from your geo tests. That geo holdout on Meta did not infer anything. It turned Meta off in real cities and measured what actually happened. It is proof, not correlation.
Calibration feeds that proof into the model.
- You run a geo incrementality test on a channel, the way the last playbook described.
- It gives you a real, causal number. Meta's incremental ROAS is 1.7x, measured, not modeled.
- You hand that number to the MMM as a strong prior, a starting belief the model has to argue against with evidence.
- The model can no longer wave its hands about Meta. It is anchored to a fact.
This is not a hack. It is built into the current tools. Google's Meridian is explicitly designed to translate experiment results into priors, and in 2026 Google shipped GeoX specifically to run these geo tests and pipe the results straight into the model as calibration. Meta's Robyn has ground-truth calibration built in too.
The effect is sharp. Take a channel the model was unsure about because its spend moved in lockstep with another. A single geo test on that one channel gives the model a fixed point to anchor to, and it stops guessing. You do not need to calibrate every channel. Anchoring even one or two of the ambiguous ones drags the whole model closer to reality.
An MMM calibrated against real experiments is worth building. An MMM built on two years of correlation and nothing else is a regression that tells you what you want to hear.
What should you do Monday?
The honest answer for most brands reading this: not yet.
MMM earns its place when you are spending across four or more channels, several of which you cannot cleanly test one at a time, and you have roughly two years of varied spend history sitting in one place. Most Seed to Series A brands do not have that, and building an MMM on thin or flat data gives you false precision, which is worse than no number at all.
So before MMM, get the prerequisites in place. They are the earlier playbooks in this series.
- The warehouse. MMM needs every channel's weekly spend and your revenue in one clean, reconciled table. That is the single source of truth from playbook six. Reconcile spend against what finance actually paid, or the model inherits your worst data.
- The geo tests. Calibration is what separates a useful MMM from an expensive one, and calibration runs on the incrementality tests from playbook eleven. Run them first. They are valuable on their own and they are what makes the model trustworthy later.
- Varied spend, on purpose. If you want to model a channel next year, move its budget around this year. Steady spend is good discipline and terrible data. Give the model something to learn from.
When you do build it, read the output as ranges, not gospel. The current tools are Bayesian, which is a feature, not jargon: they hand you a plausible range and a confidence level for each channel, not a single false-precise number. A channel whose range runs from 0.8x to 4.0x is the model admitting it does not know, usually because that channel never varied or moved with another. Believe the ranges. Point estimates lie by omission.
And once it is calibrated and you trust it, MMM does the one thing nothing else in this series can. It looks at your entire budget at once and tells you where the next rupee earns the most. Incrementality told you which channels were real, one at a time. MMM tells you how to split all of them together.
Frequently asked questions
What is marketing mix modeling?
A way to divide a whole budget across every channel at once, including the ones you can't turn off. It takes about two years of weekly data and infers what each channel contributed from how revenue moved as spend moved. It's a model, not a measurement — most vendor decks won't tell you that.
How is MMM different from incrementality testing?
Incrementality testing tells you whether one channel is real — you turn Meta off in a few cities and read the gap. But you can only test one channel at a time. MMM asks the same question about your entire business at once, across every channel.
What data does MMM need?
A spreadsheet, not user data. One row per week going back roughly two years, with a column for each channel's spend and a column for revenue. No user IDs, no cookies, no attribution windows — which is why MMM survives iOS privacy changes.
What is base revenue?
The part of your revenue that happens no matter what you spend — repeat buyers, organic traffic, people searching your brand. For the brand in this post it's the single largest driver, larger than any channel. It's also the number attribution can never give you, and the reason platform ROAS is inflated.
Why does my Meta spend need to vary for MMM to work?
Because the model learns what Meta did by watching what happened when Meta spend moved. A channel held flat across two years gives the model nothing to learn from, and its contribution estimate will be unreliable no matter how good the modelling is.
What are adstock and saturation?
Adstock is the fact that today's spend keeps selling for days afterwards. Saturation is the fact that the tenth lakh you spend doesn't buy what the first one did. Both are curves MMM has to fit, and getting them wrong is a common way for a model to look confident and be wrong.
Do you need to calibrate MMM?
Yes, or don't bother. Calibrate the model against a real incrementality test. In the example here, MMM put Meta's marginal ROAS at 1.7x — the same number the geo holdout found — and that agreement is what makes the rest of the model trustworthy.
Want this on your own stack?
Datalyze rebuilds your data foundation, then finds the growth it's been hiding — proven across 150+ startups.
Book a free analytics audit →