How to Set Up Product Analytics the Right Way

The short version: Pick one tool (PostHog if you want a warehouse bundled in, Mixpanel or Amplitude if you want the deepest pure product analytics). Write a tracking plan before anyone writes tracking code. Get proxy, server-side and identity stitching right at implementation. Then lay your numbers out as a funnel and start asking why.
You've launched. You have users. The product is stable. And now you want to stop guessing and actually look at your data.
This is the moment almost everyone gets wrong.
A team decides to get serious about analytics, spends six months and a good chunk of money, and ends up with data they don't trust and no insight to show for it. Then they call someone like me to unpick it.
It usually breaks in one of two places.
The first is the tool. Founders keep coming to me saying they've run GA4 for a year and still can't get a straight answer out of it. That's not a them problem. GA4 is built for traffic and marketing, and it's good at that: where visitors came from, which campaign drove them. It is not built to tell you what a user actually did inside your product before they left. User-level funnels are shallow, retention is thin, and the moment your questions get interesting the tool taps out.
The second is the implementation. This one's sneakier. The team installs a real product analytics tool, PostHog or Mixpanel or Amplitude, and still ends up with garbage. Events named three different ways. No identity stitching. Properties nobody set up. Data that looks fine right until you try to make a decision with it.
Step 1: Which product analytics tool should you pick?
Mixpanel and Amplitude are near-twins. Both do deep product analytics and both do it well. My pick is Mixpanel. The learning curve is gentler and it's faster to build reports in. Amplitude can feel sluggish once you're deep in it. But you won't go wrong with either.
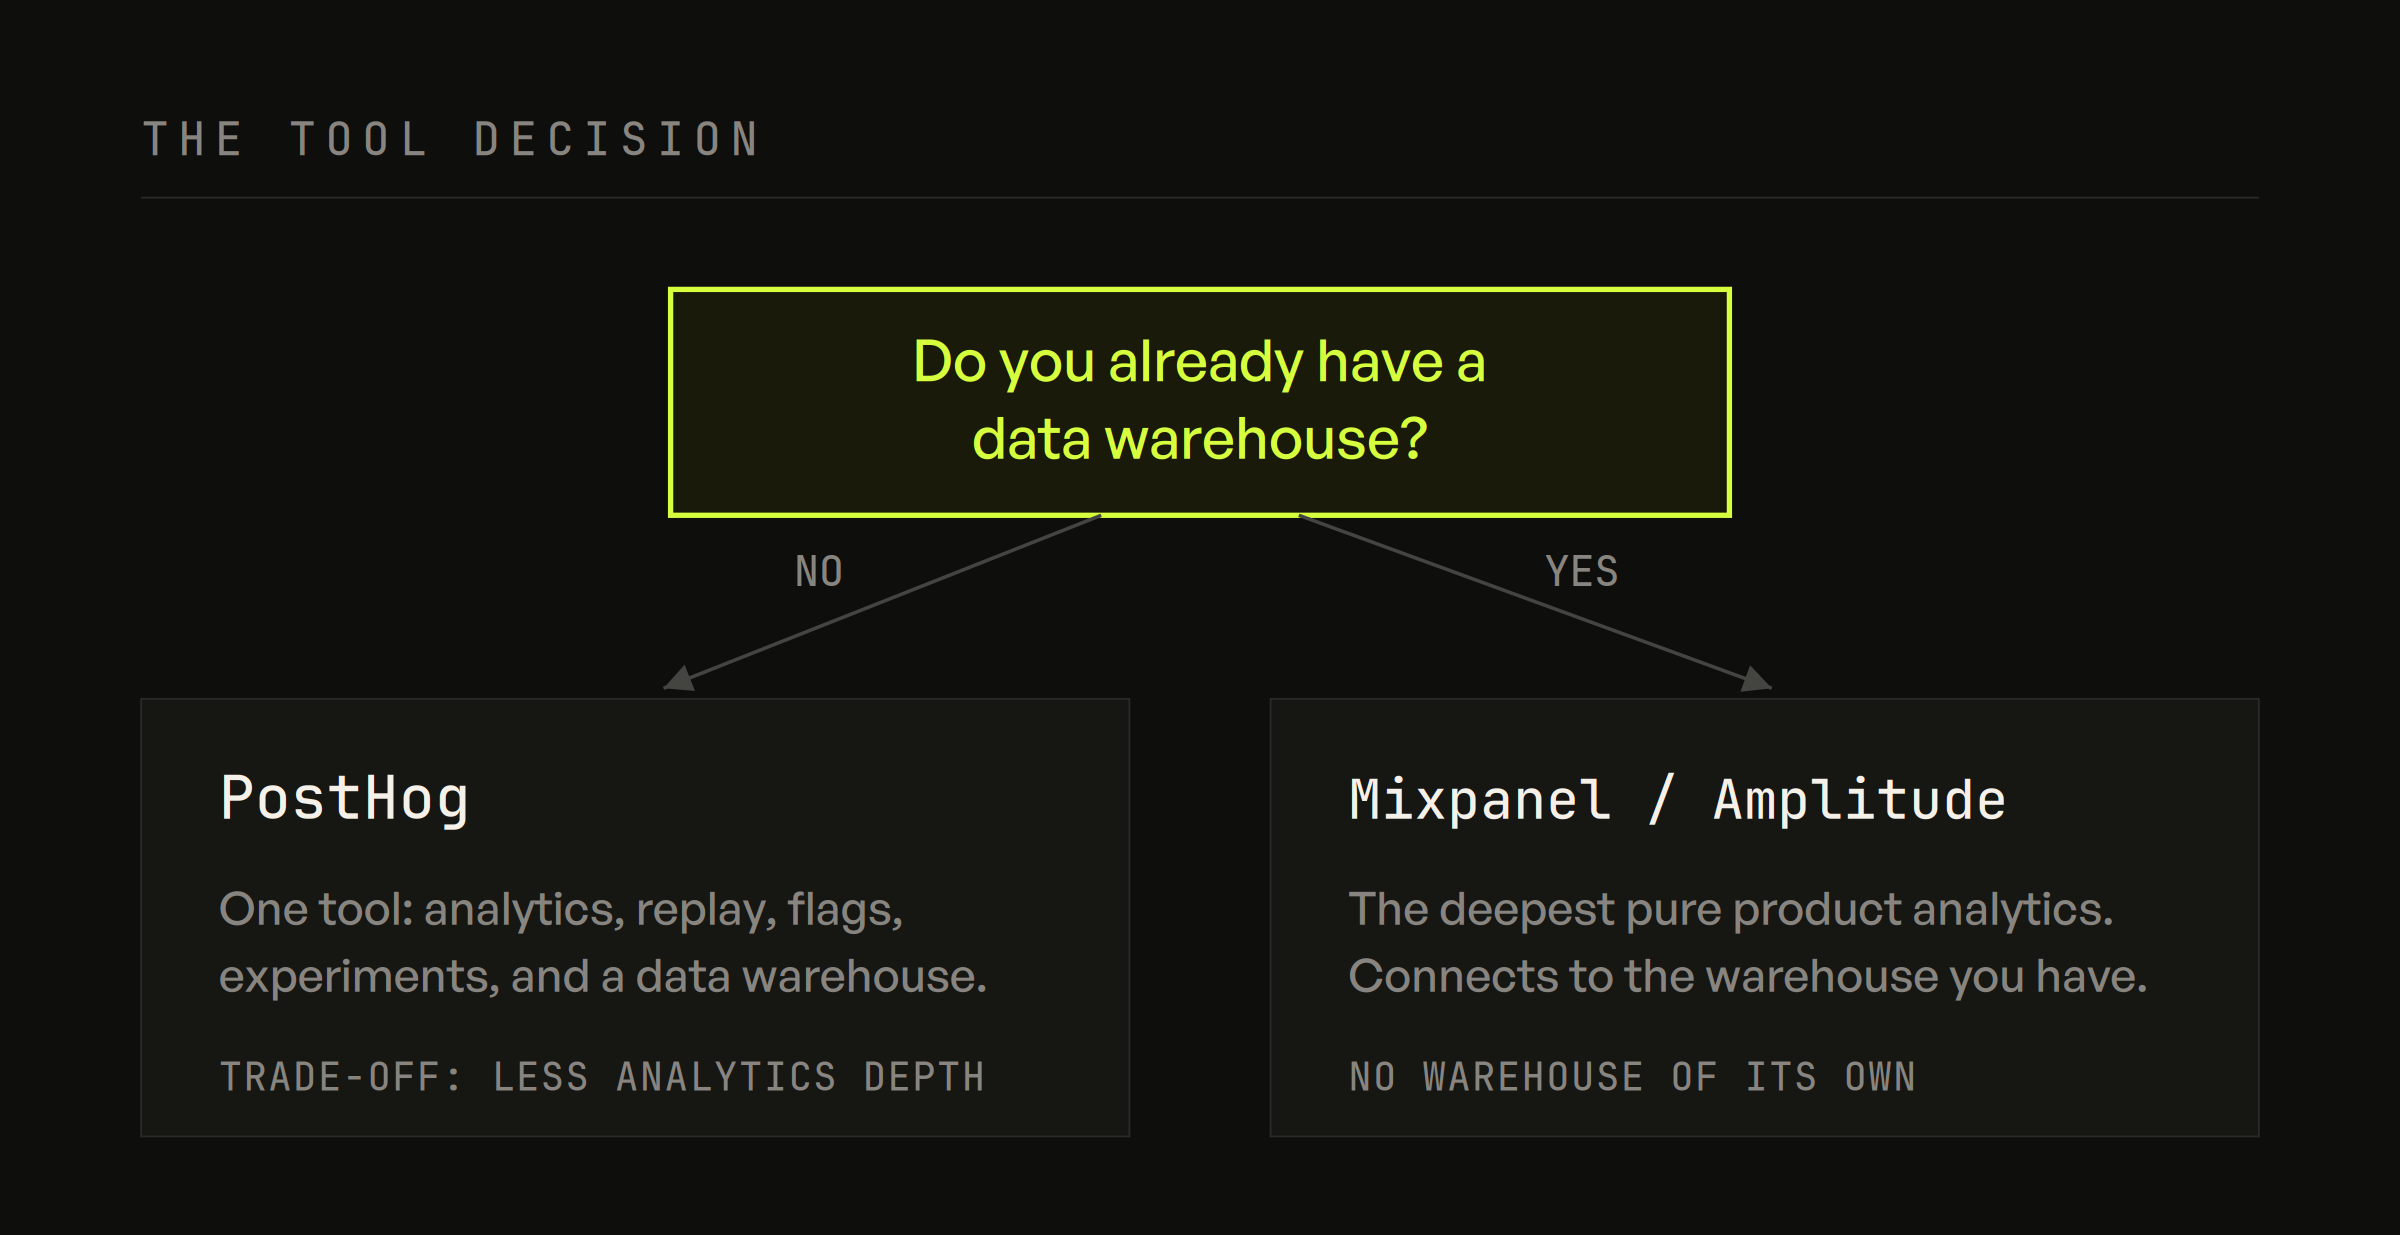
The real decision isn't Mixpanel vs Amplitude. It's PostHog vs the other two.
PostHog is a horizontal tool: product analytics, session replay, feature flags, experiments, surveys, and a built-in data warehouse, all under one roof. The trade-off is depth. Its product analytics isn't as strong as Mixpanel's or Amplitude's, and building a complex report through the UI gets painful. For anything deep you drop into SQL, which costs you time.
But PostHog gives you an actual data warehouse. You can run SQL across your product events and external data it pulls in from Stripe, Google Ads, HubSpot, and thirty-odd other sources, all in one place. Mixpanel and Amplitude don't.
So here's the fork.
If you want it all in one place, plus a warehouse you don't have to stand up separately, PostHog is hard to beat.
If you already have a warehouse, or you just want the best pure product analytics tool and nothing else, go with Mixpanel or Amplitude.
That's the whole decision. If you want the longer version of the PostHog trade-off, I've written a whole post on my love-hate relationship with it.
Stuck on which tool actually fits your product? Book a call and I'll help you pick the right one before you commit to a setup.
Step 2: What goes in an event tracking plan?
This is where most setups quietly die. If your events are wrong, everything downstream is wrong, and you won't find out until you're staring at a funnel that makes no sense.
Before anyone writes a line of tracking code, build a tracking plan. It's a simple document, usually a Google Sheet, that lists the user actions you want to track (events) and the details you want to capture with them (properties). Skip it and you get messy data, missing insight, and wasted dev time. I've written a full guide on building one.
A few things that matter most.
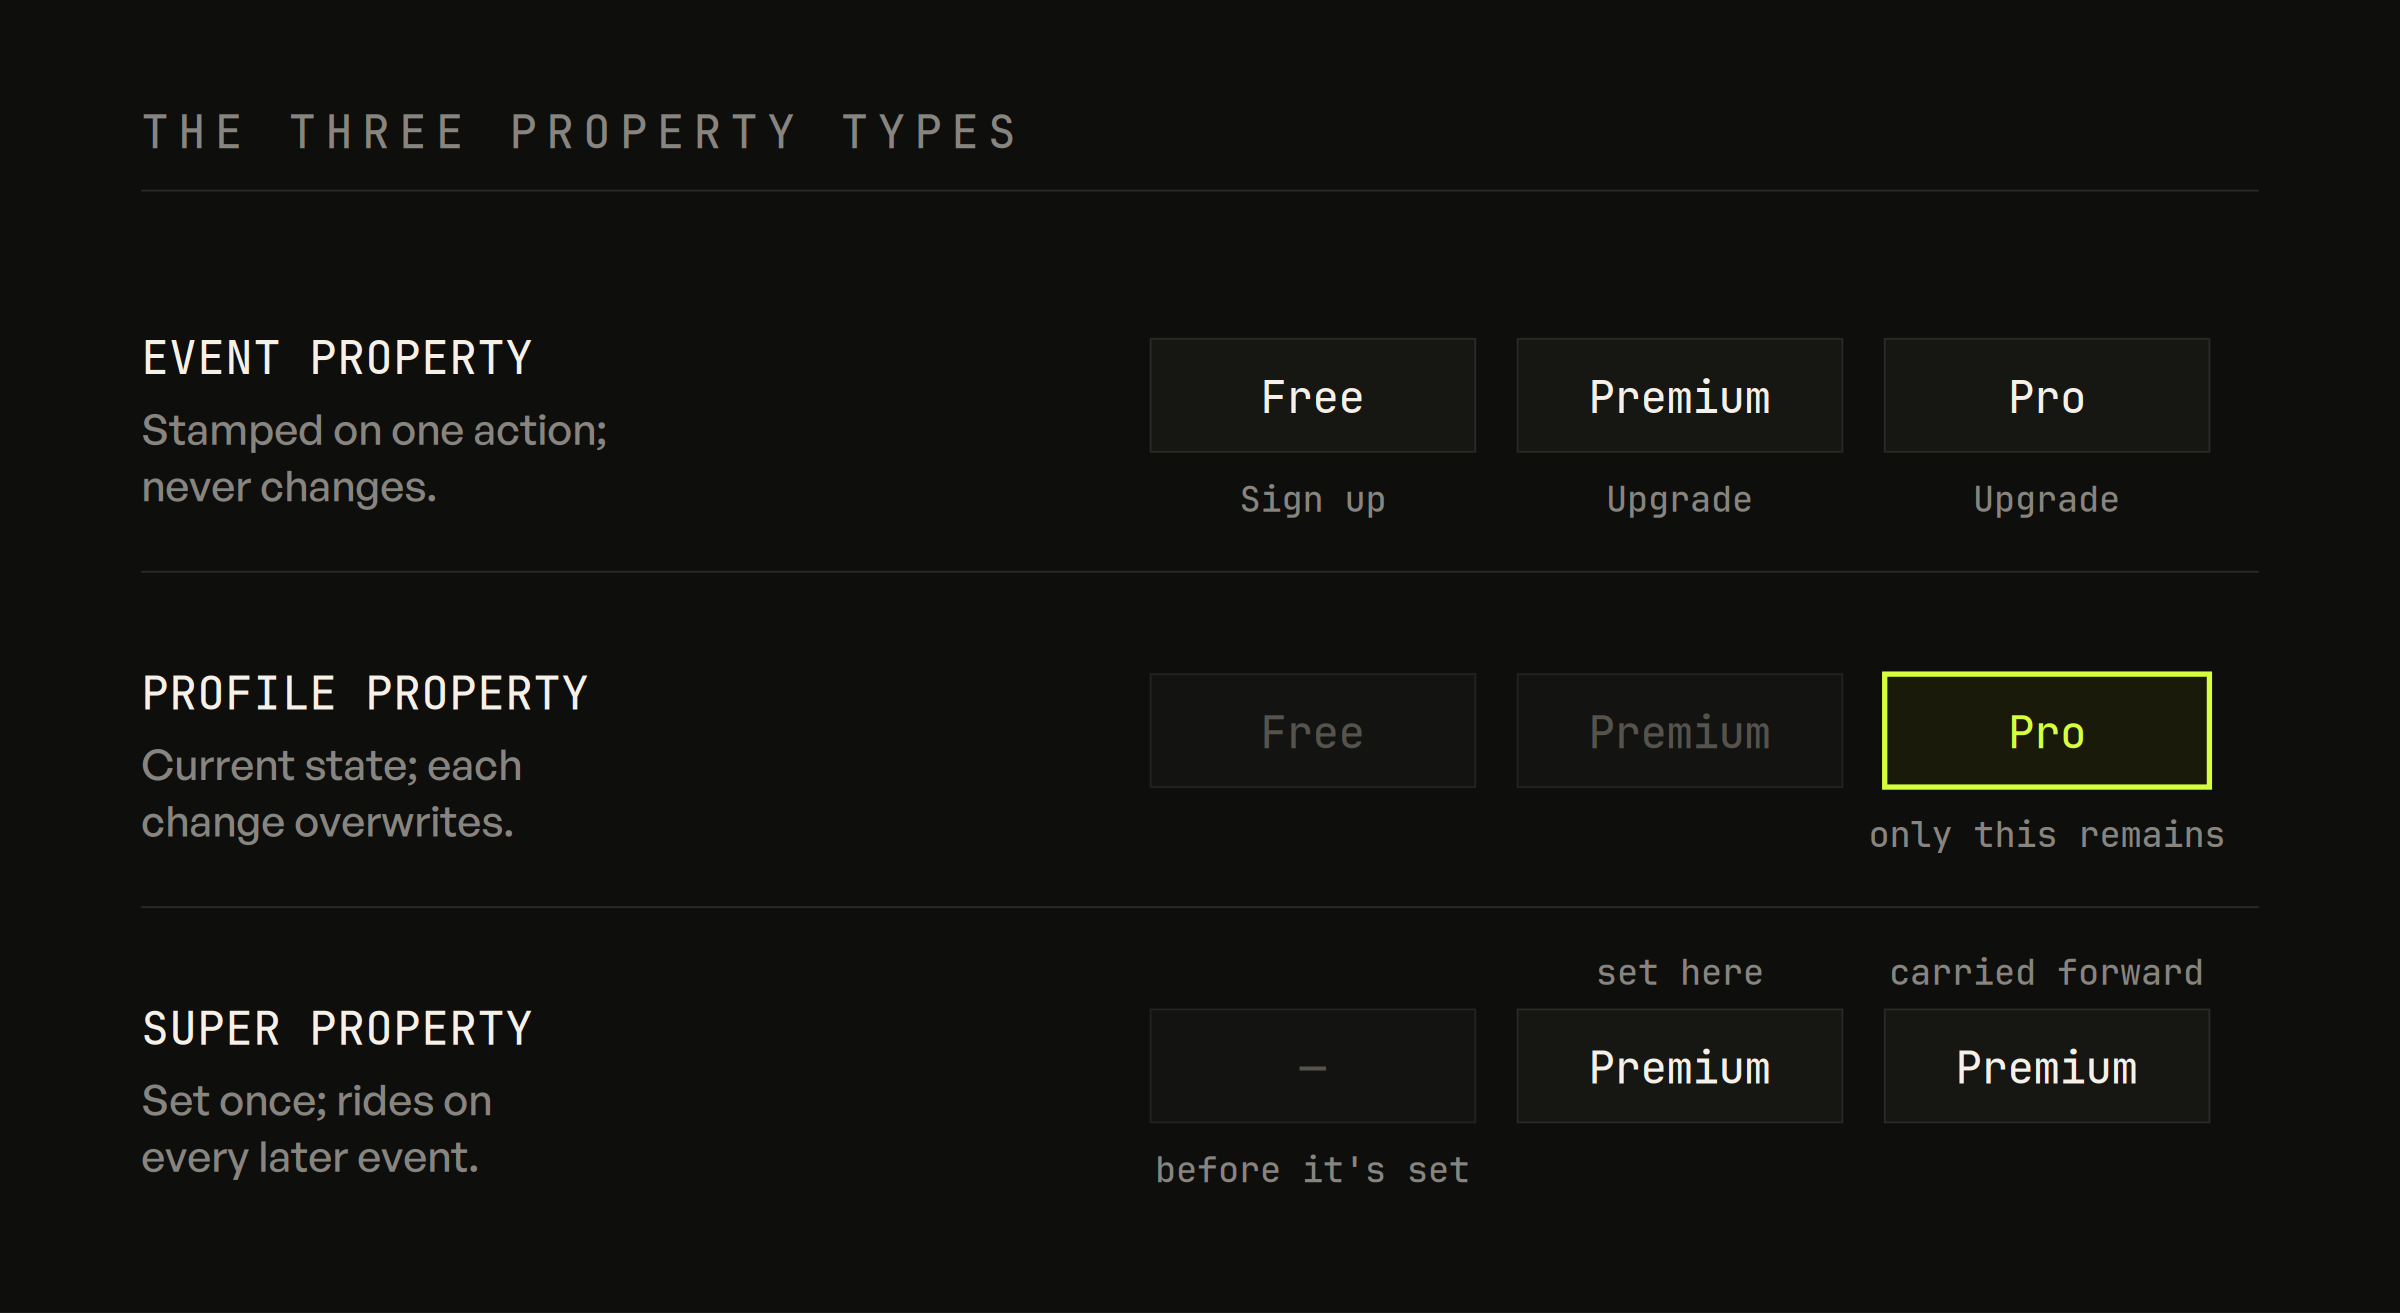
Track properties, not just events. Most setups I see track events and stop there. That's half a setup. Properties are what let you actually answer questions. And know the three types: event properties, tied to a single action; profile properties, the user's current state, which updates over time; and super properties, attached to every event after they're set but they don't rewrite the past. Getting these right is the difference between "how many people upgraded" and "what plan was someone on when they hit their fifth upload."
Track only what's actionable. You need the events that tell you how people move through your product. One company I worked with had 500 events flowing into their tool. When I audited it, 50 were actually being used. The rest was noise someone had spent weeks instrumenting. The test is simple: if you don't track this, do you lose an insight you'd act on? If not, leave it out.
Start shallow, go deeper later. For a one-page form, track "form submitted" first. If you see drop-off, then go add the field-level events. Don't instrument every keystroke on day one.
Name things consistently. Pick a convention, action-based, outcome-based, object-action, whatever, and stick to it, casing included. "Signup Completed" and "sign_up_complete" and "completed signup" in the same project is how you end up not trusting your own dashboards.
Structure events sensibly. Similar actions go in one event with a property. Genuinely different actions get their own events. In e-commerce, track "product viewed" with a product property, not a separate event per product. In SaaS, give each feature its own event instead of cramming them all into one.
The tracking plan is the step most teams underestimate, and the one everything else depends on. If you'd rather get it right the first time than redo it in six months, book a call.
Step 3: What does your developer have to get right?
You've got a tool and a tracking plan. Now it gets built, and there are three things your developer has to get right. Get these wrong and the cleanest tracking plan in the world still hands you numbers you can't trust.
Proxy and server-side tracking. Ship your analytics through a proxy on your own domain, and send your important events from the server, not just the browser. Ad blockers block analytics scripts. Safari's tracking prevention caps browser-set cookies at around seven days, so returning users start looking like brand-new ones and your counts inflate. It's real, it's silent, and I've watched it swallow a meaningful chunk of events, more when your users skew iOS or technical. A proxy and server-side setup gets most of it back.
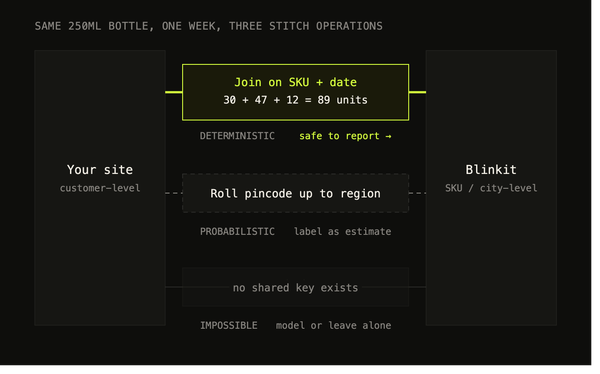
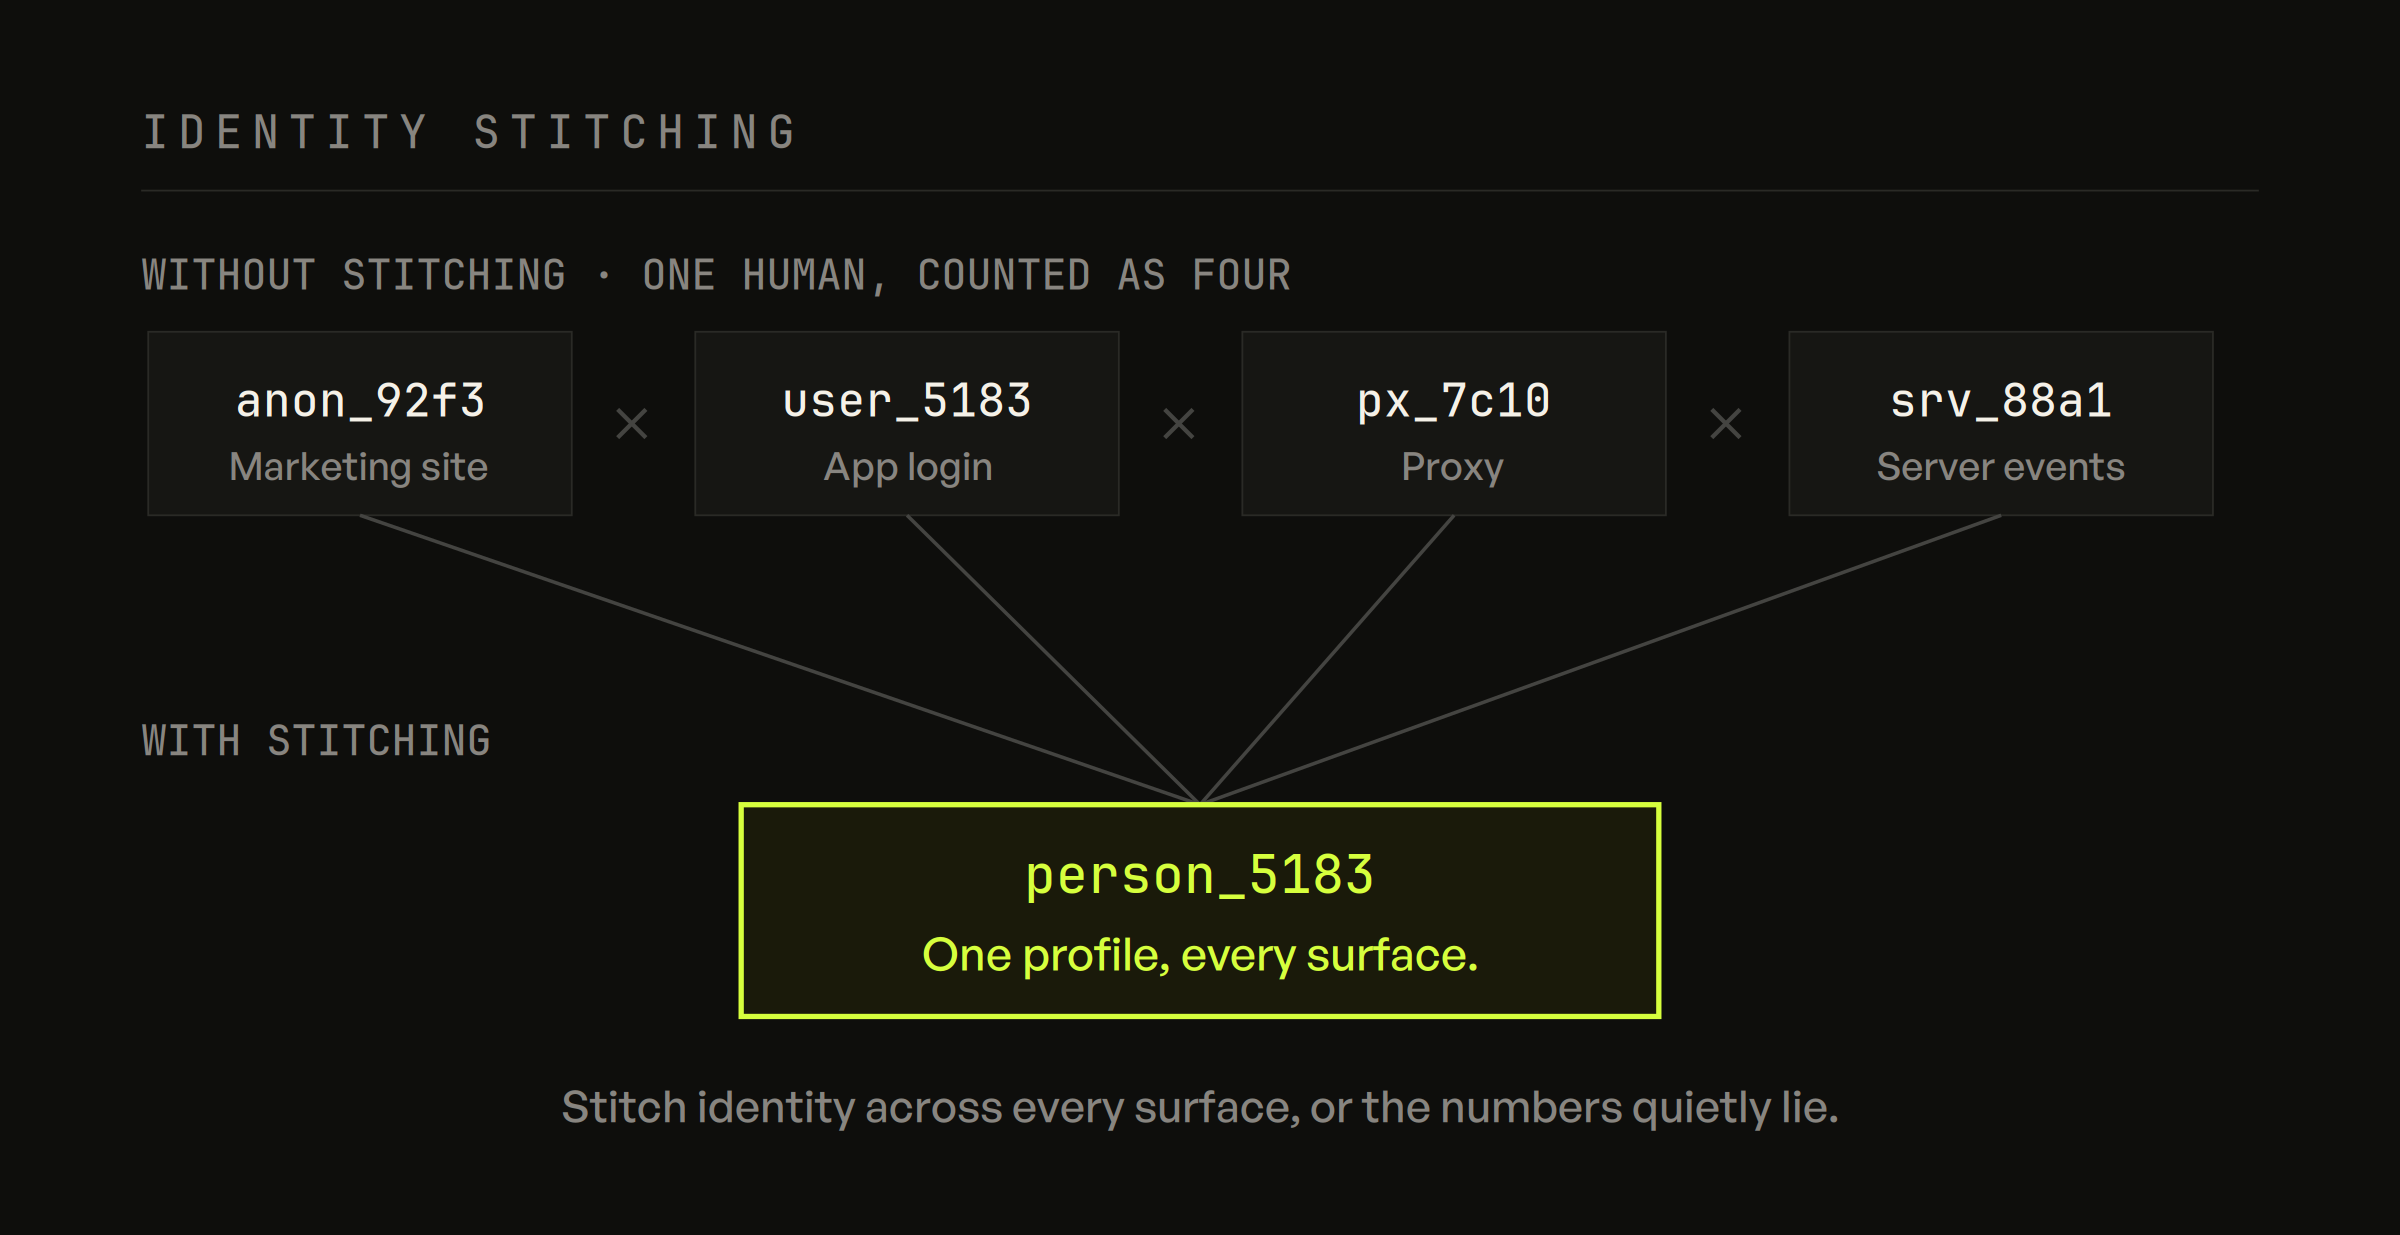
Identity stitching. This is the one that quietly breaks everything. Your marketing site lives on one domain and your app on another. A person lands on the site anonymous, signs up, and becomes a logged-in user in the app. If you don't stitch those together, that's two people to your analytics, not one. Same story across your proxy and your server-side events. Get this wrong and every funnel, every retention curve, every "where do my paying users come from" answer is broken, and it all looks fine until you dig in. I've written separately about joining your marketing and product data, which is the same problem.
If you want the implementation checked before your dev ships it, book a call and we'll make sure the data you build on is data you can trust.
Verify it by hand. Once events are live, go through your product, fire every event from every surface, and check it lands in your tool with the right properties and values. This is boring and it's non-negotiable. TermPlus came to me already running PostHog. The tool was fine. The setup wasn't. Events fired inconsistently, naming was all over the place, and nobody trusted the funnels. We rebuilt the plan, walked their engineers through the implementation, and verified every single event before calling it done.
If you want the implementation checked before your dev ships it, book a call and we'll make sure the data you build on is data you can trust.
Step 4: How do you lay out your numbers? The Pirate Funnel
Now you have clean data. Time to actually look at it.
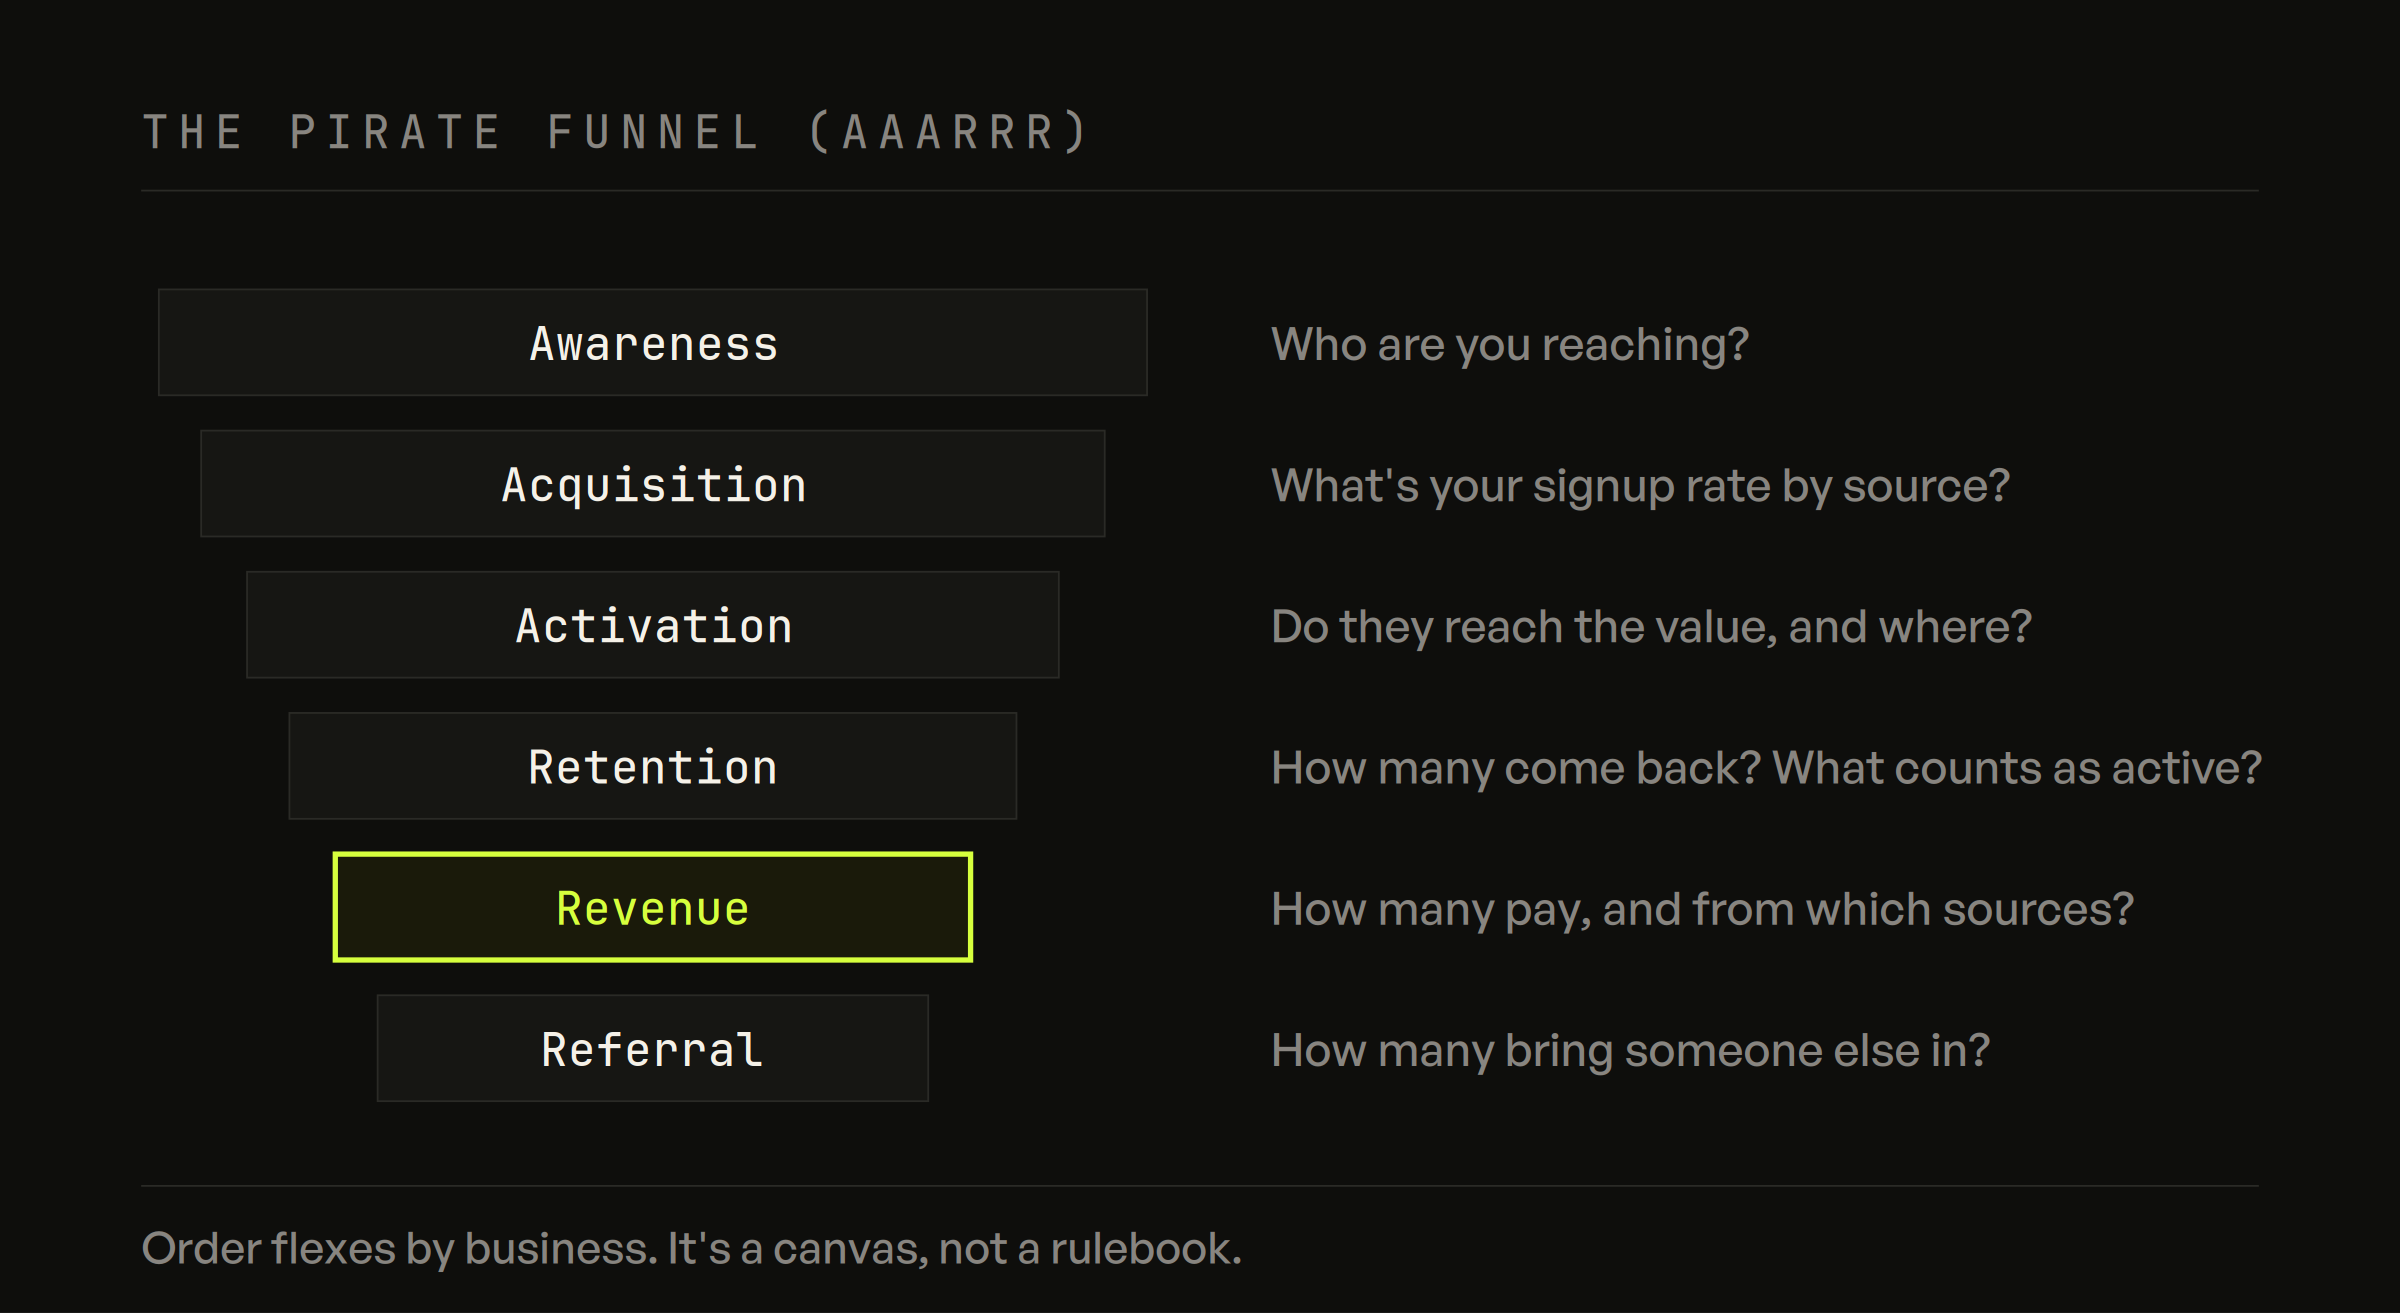
Every product is a funnel. People find you, sign up, start using it, come back, pay, and tell someone else. A useful way to lay this out is the Pirate Funnel, AAARRR: Awareness, Acquisition, Activation, Retention, Revenue, Referral. Some businesses care about revenue before retention, some the other way. It's a canvas, not a rulebook.
Break your product into those stages and define one metric for each. The questions you're answering:
Awareness and acquisition: Where are people coming from? What's your signup rate by source?
Activation: How many people reach the point where they actually get the value, and on which feature?
Retention: How many come back? And what even counts as an active user for you?
Revenue: How many pay? Which sources bring the people who pay, not just the people who sign up?
Referral: How many bring someone else in?
Build that into a dashboard. This is the moment you become data-driven. Not because a dashboard is the goal, but because now you can see the whole shape of your product in one place. The leaks show up. You know where to look.
Step 5: How do you turn a dashboard into growth?
The dashboard isn't the finish line. It's the starting line.
It tells you what's happening. It doesn't tell you why, and it doesn't fix anything on its own. That part is a loop. You look at the numbers, find the weak spot, form a hypothesis about why, and run an experiment to test it. You ship the change, and you watch what it does to the metric that matters. Then you do it again.
Use your analytics as an insight tool, not an information tool. If all you ever do is pull metrics, you're using a fraction of what it's for.
If this sounds like a lot, it's because it is. The right tool, a real tracking plan, identity stitched properly, every event verified, and then something you can actually reason from. That's the exact stretch where most teams lose months.
This is what I do. At Datalyze we've set up and cleaned up analytics for 150+ companies, and this is the path we walk every time. If you'd rather not learn it the slow way, book a call and we'll get it right the first time.
Frequently asked questions
Is GA4 enough for product analytics?
No. GA4 is built for traffic and marketing — where visitors came from, which campaign drove them — and it's good at that. It is not built to tell you what a user did inside your product. User-level funnels are shallow and retention is thin, which is why founders run it for a year and still can't get a straight answer.
Mixpanel vs Amplitude — which should I use?
They're near-twins and you won't go wrong with either. I pick Mixpanel: the learning curve is gentler and it's faster to build reports in. Amplitude can feel sluggish once you're deep in it. The real decision isn't Mixpanel vs Amplitude — it's PostHog vs the other two.
When should you choose PostHog instead?
When you want product analytics, session replay, feature flags, experiments and a data warehouse under one roof, and you don't already have a warehouse. The trade-off is depth: PostHog's product analytics isn't as strong, and complex reports push you into SQL.
How many events should you track?
Only the ones that change what you'd do. One company I worked with had 500 events flowing into their tool; when I audited it, 50 were in use. The rest was noise someone had spent weeks instrumenting. The test: if you don't track this, do you lose an insight you'd act on?
What is identity stitching, and why does it break setups?
It's joining a person's anonymous activity to their logged-in activity so they count as one user, not two. Your marketing site and your app are usually different domains, so without stitching every funnel, retention curve and "where do my paying users come from" answer is wrong — and it all looks fine until you dig in.
Do you need server-side tracking and a proxy?
Yes, for anything that has to be exact. Ad blockers block analytics scripts, and Safari's tracking prevention caps browser-set cookies at around seven days, so returning users start looking brand new and your counts inflate. A proxy on your own domain plus server-side events for the important actions gets most of it back.
Want this on your own stack?
Datalyze rebuilds your data foundation, then finds the growth it's been hiding — proven across 150+ startups.
Book a free analytics audit →