Your Cheapest Channel Is Probably Your Worst

You're running paid across a few platforms. Google, Meta, maybe TikTok or LinkedIn. You've set up conversion actions, you check each dashboard, and you make budget calls off what they report. Channel looks good, put more in. Channel looks bad, pull back.
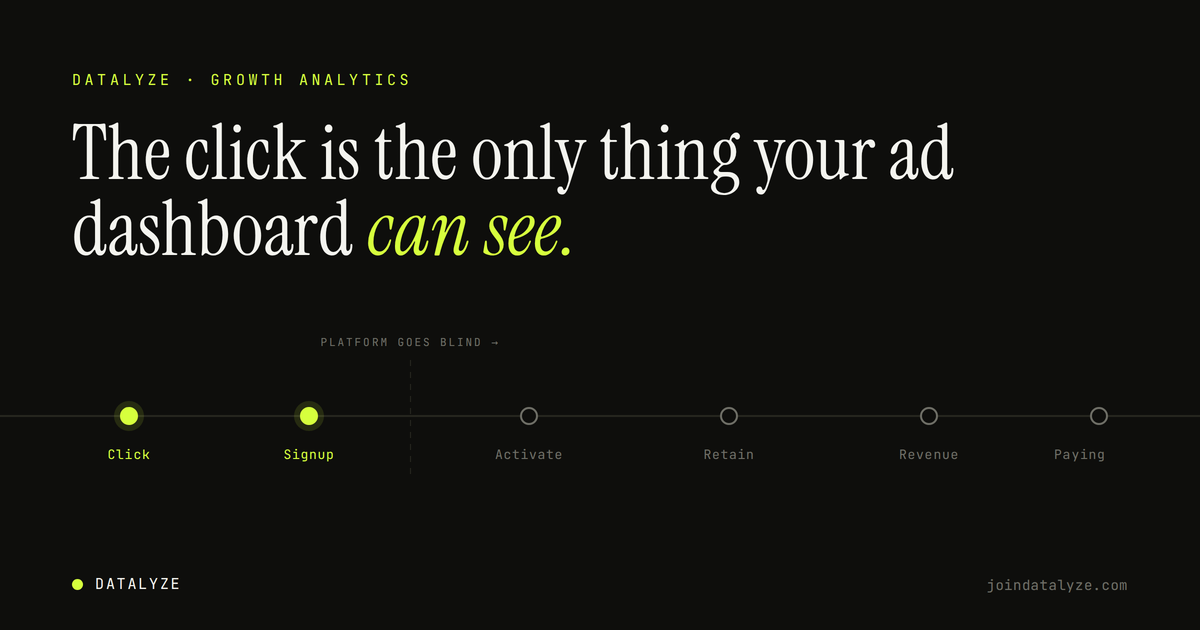
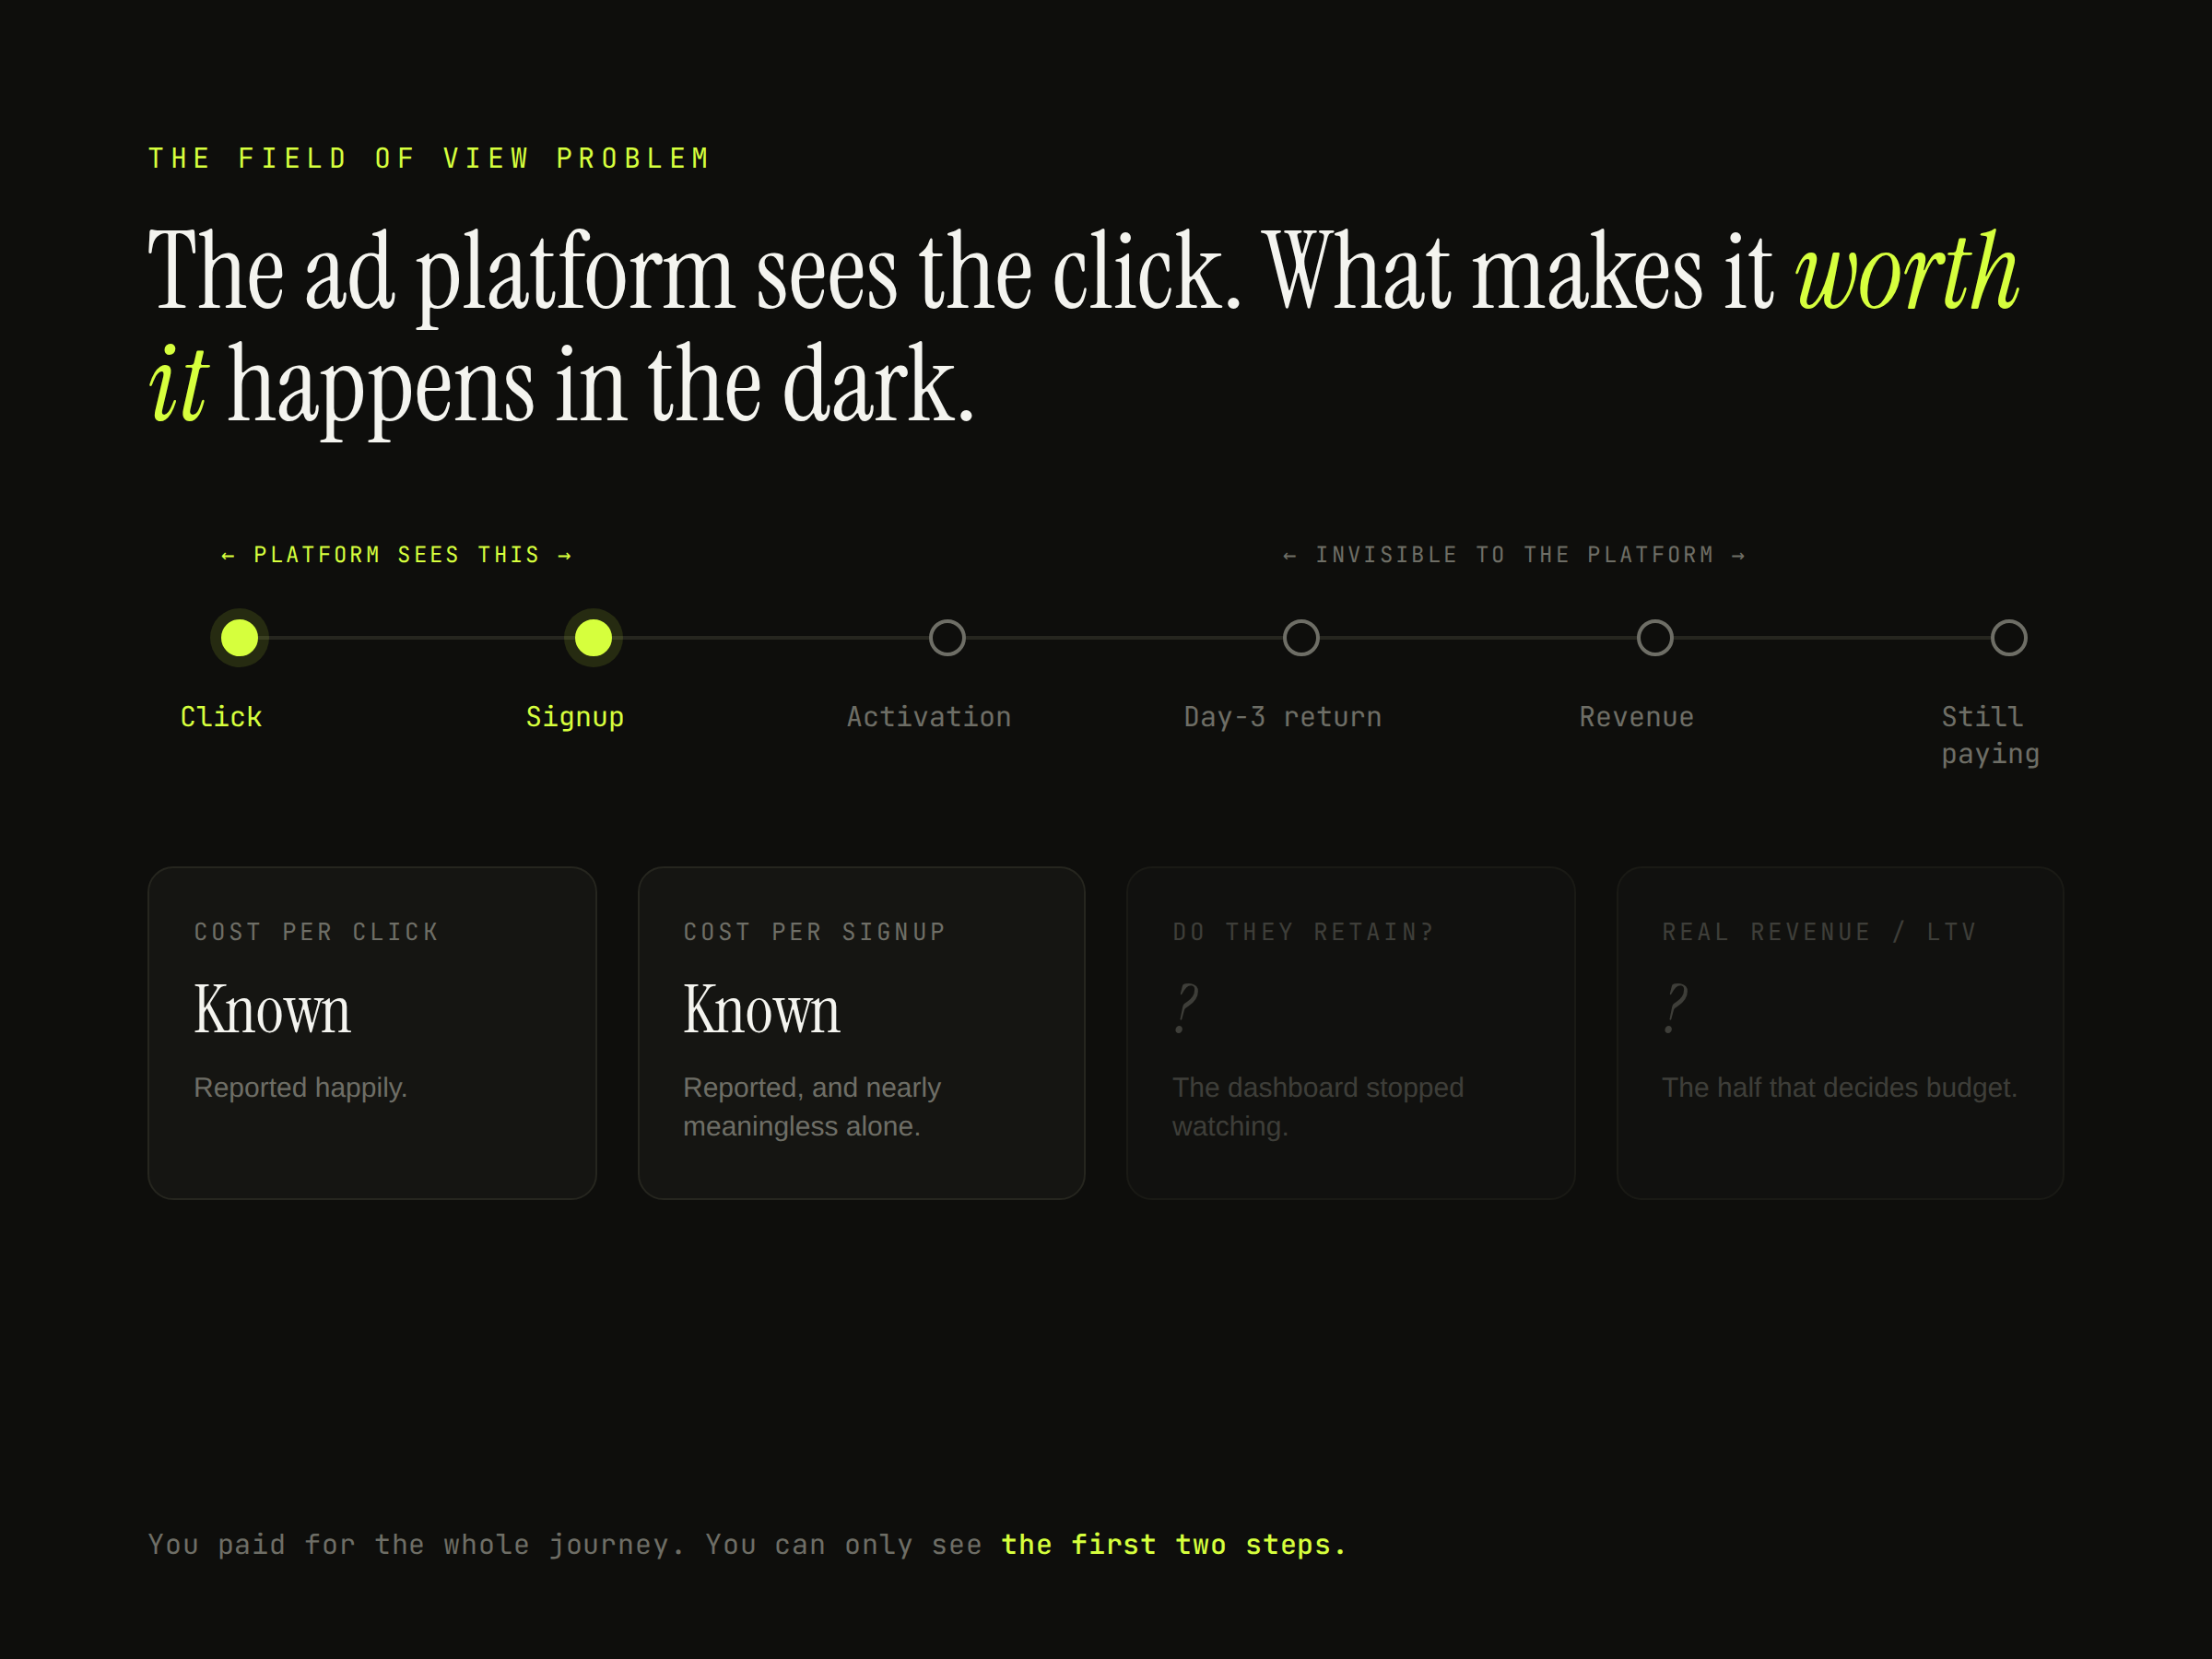
Here's the thing nobody tells you when you start. The ad dashboard can see exactly one moment in a user's life: the click, and whatever it decides to count as a conversion in the hour or two right after. Everything that happens next, whether the person activated, whether they came back on day three, whether they're still paying you in month four, is completely invisible to the platform that took your money.
So the questions you actually care about are the ones you can't answer today:
Do users from this specific campaign convert to paying? How much revenue do they bring over their life? Do they activate at a decent rate, or do they sign up and vanish? Do they retain better or worse than users from the other campaign? What's the real cost to acquire a customer who sticks, per channel?
You can't see any of it. Not because you're doing anything wrong, but because you're asking a tool to answer questions it was never built to answer. Most of this comes down to one specific, deeply boring piece of plumbing, and one naming rule that quietly decides whether the whole thing works or falls apart.
First, get off GA4
If you're trying to answer any of this with Google Analytics, stop. GA4 is not built for it. You can't cohort by campaign in the Explorations interface, user-level data ages out on you, and the moment you want to attach revenue to the person and follow them over time, you're exporting everything to a warehouse and rebuilding the analysis by hand anyway.
Stand up a real product analytics tool. PostHog, Mixpanel, or Amplitude. Any of the three works. Pick one, get your events flowing, come back. Here's a full guide I've written around that.
Your product tool already has half the picture
Once you're on one of these tools, half the work is already done for you.
PostHog, Mixpanel, and Amplitude automatically capture the UTM parameters off the URL a user arrives on. Source, medium, campaign, all of it, stamped onto that person's profile the first time they land. You know that this user showed up from a URL tagged utm_campaign=summer_launch, and you know every product event they fired afterward.
The other half, the two pieces that actually let you answer the money questions, you have to bring in yourself. Your ad data, and your revenue data.
Get your ad data in, and mind the one rule that makes or breaks it
Your product tool knows a user arrived from summer_launch. What it doesn't know is that summer_launch cost you four thousand dollars last week, or that it served two hundred thousand impressions, or what you paid per click. That lives in your ad platforms, and you have to get it into the same place as everything else.
A few ways to do that. You can run an external connector like Fivetran or Hevo that pulls spend and campaign data out of Google and Meta and lands it in a warehouse. You can hit the ad platforms' APIs directly if you want to build it yourself. Or, if you're on PostHog, you can use its native data warehouse connectors and skip the middleman.
The mechanism is the easy part.
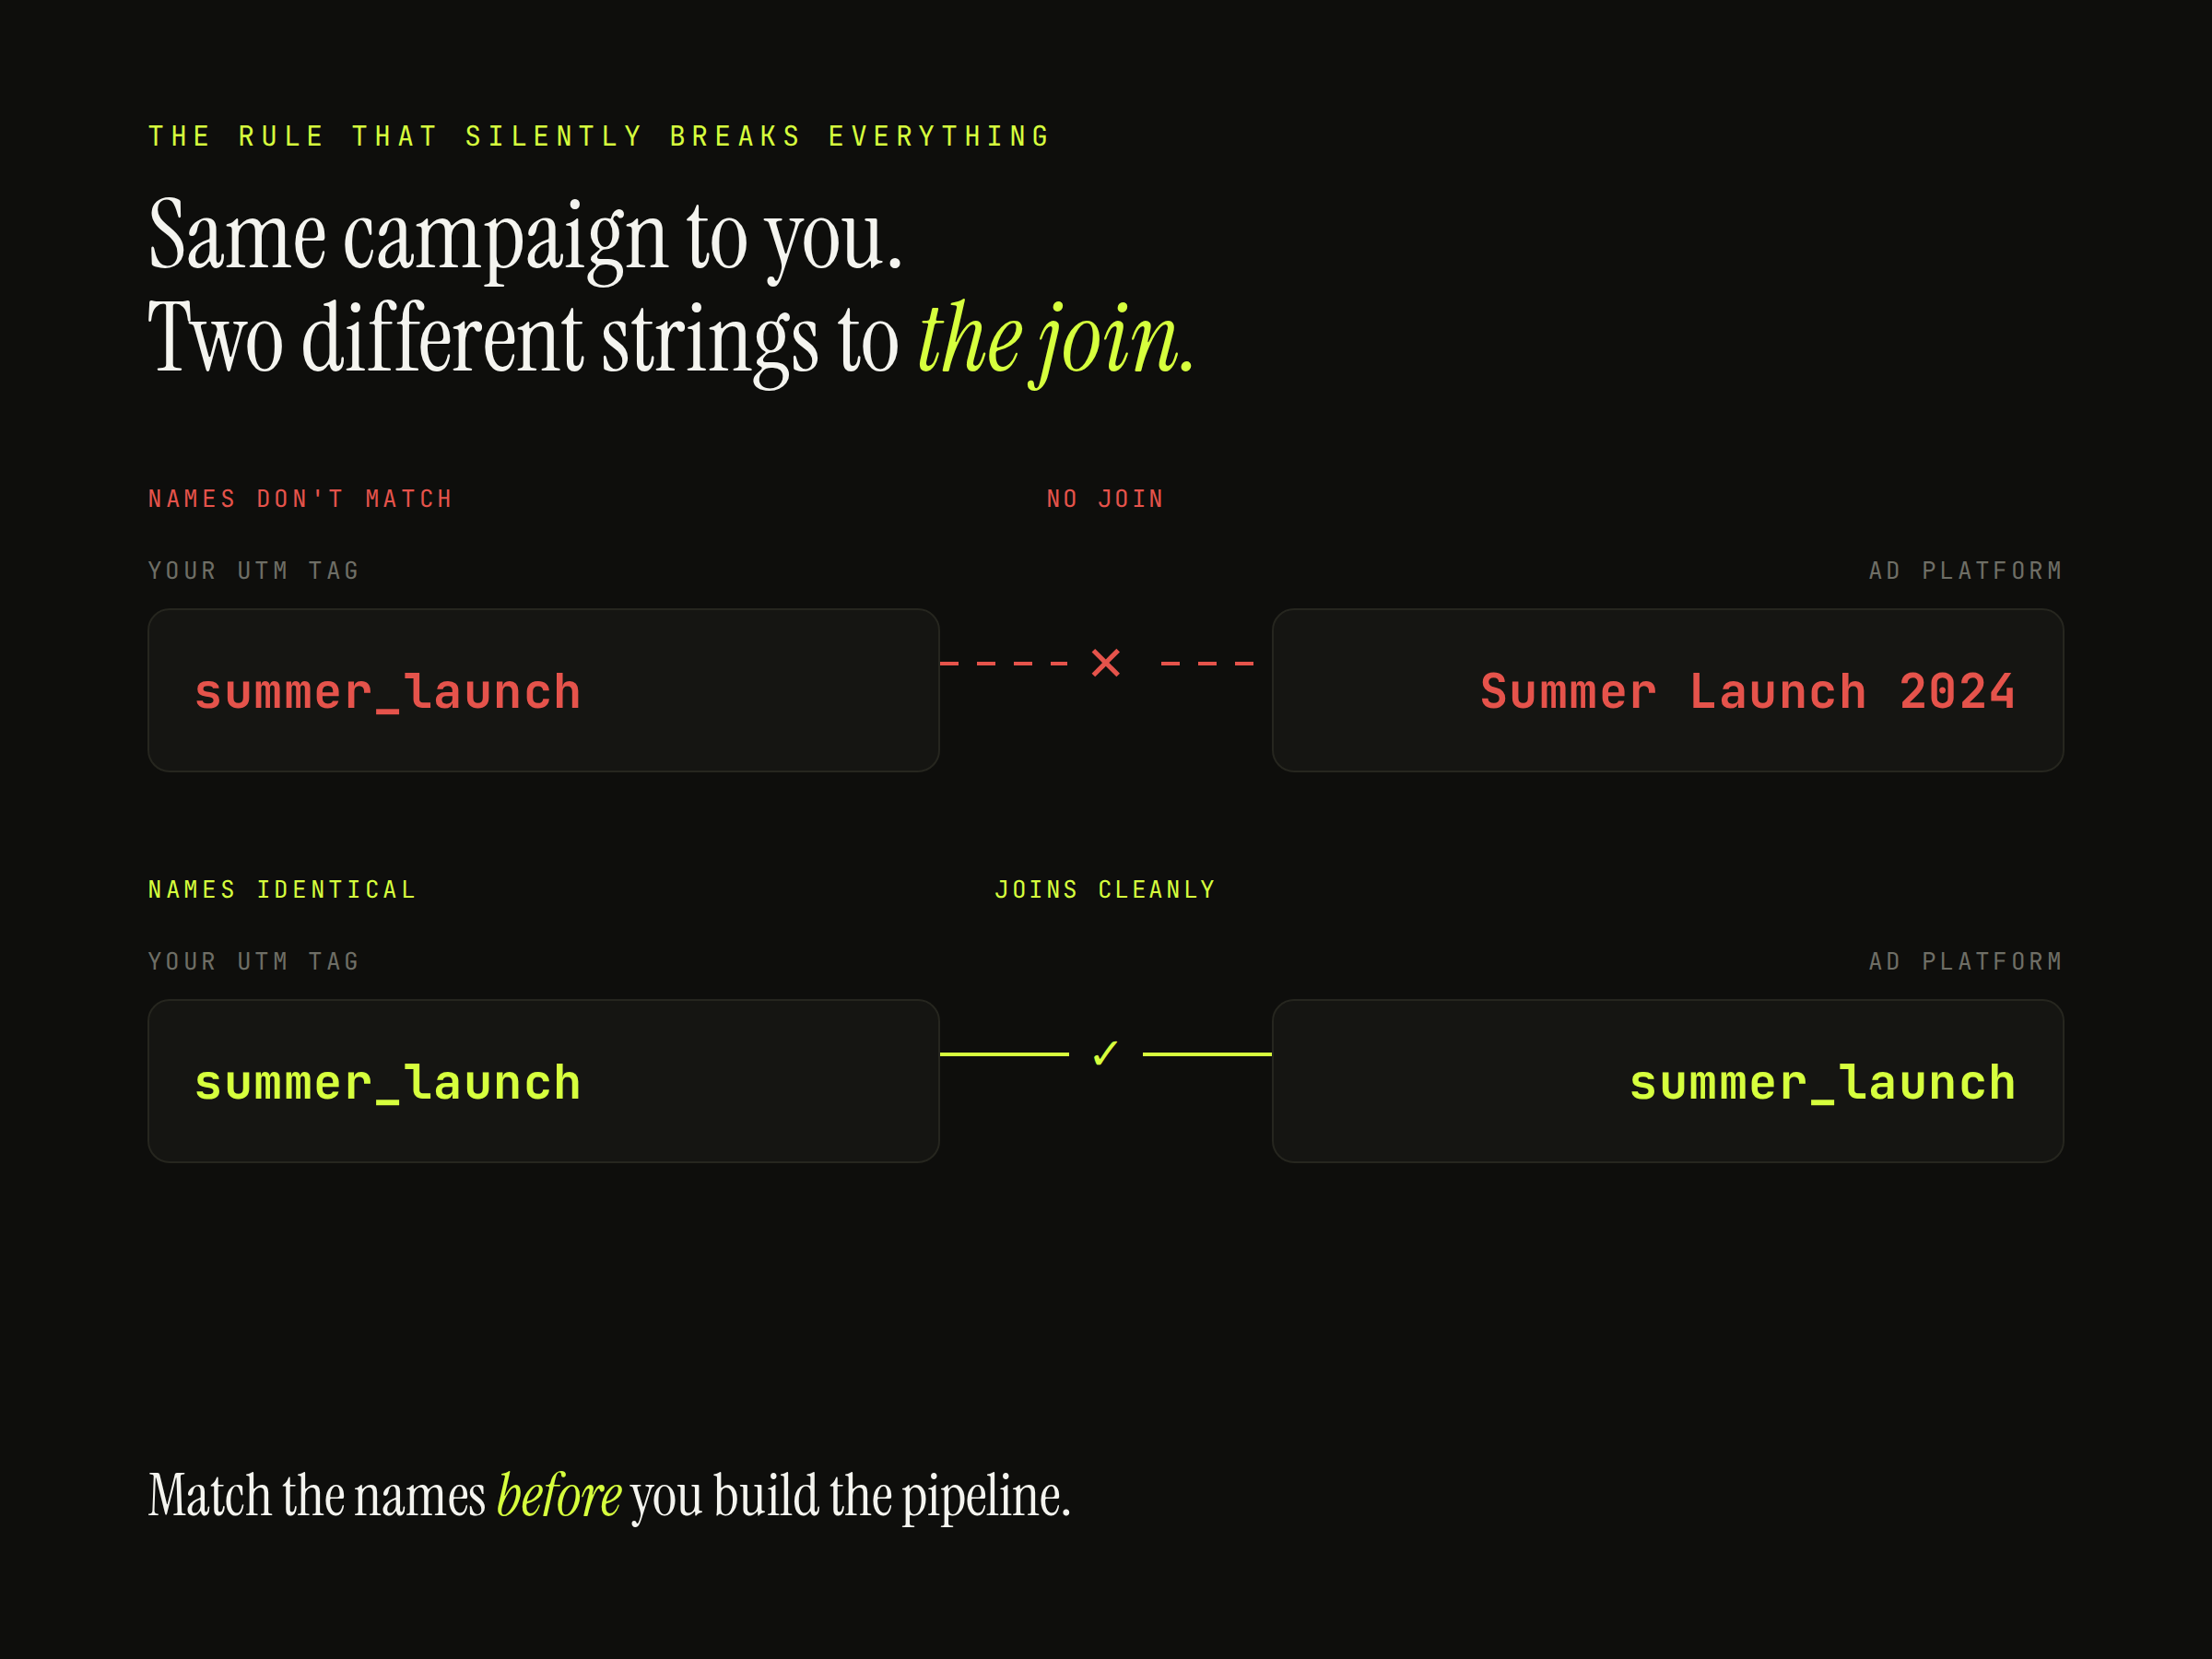
The campaign name your product tool captured off the UTM has to exactly match the campaign name in your ad platform. Character for character.
Your product tool has a user tagged summer_launch. Your ad platform has a campaign called Summer Launch 2024. To you, obviously the same campaign. To a join, two completely different strings that will never, ever line up. The spend sits in one row, the user sits in another, and nothing connects them. You'll build the whole pipeline, open the dashboard, and half your users will show up attributed to a campaign that "doesn't exist" while half your spend maps to nobody.
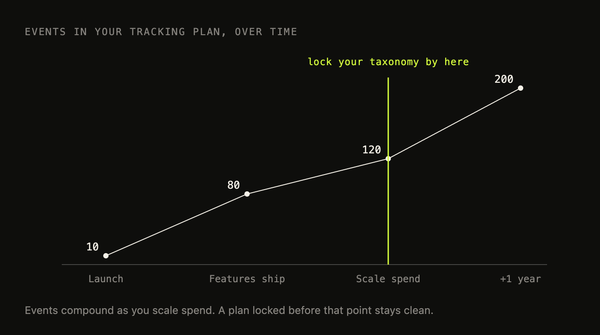
So decide on a convention before you touch connectors, and make your UTM campaign values and your ad platform campaign names identical. Lowercase-with-underscores, whatever. Pick one and hold the line. If you want the deeper version of how the warehouse, the join key, and the grain fit together, that's its own topic.
This naming and connector work is exactly the kind of thing that's simple in theory and quietly painful in practice. If you'd rather not lose a week to it, book a call and I'll help you get it wired up right the first time.
Get revenue in too, or you're measuring half a business
Now the money. To answer anything about revenue or lifetime value, the revenue itself has to be in the tool. And for most seed-stage products, revenue doesn't live in your product database. It lives in Stripe.
Same story as the ad data. You sync it in. PostHog has a native Stripe connector; the other tools have their own paths, or you go through a warehouse. The one thing that matters is that you key the revenue to the user, so that a payment attaches to the exact same profile that's already carrying the campaign tag and the product events. Once that link is made, the person who arrived from summer_launch now has their signup, their activation, their retention, and their actual dollars all hanging off one profile.
Skip this step and you can still see signups and activation by channel, which feels like progress. But you can't see the money, and the money is what decides where budget goes. You're counting how many people walked in the door, not how many bought anything.
Now you can see the whole journey, per campaign
Put the three together, product events, ad spend, revenue, all connected and all matched, and something changes that's hard to go back from.
For any single user, you can now trace the entire arc. Which campaign they came from. Whether they signed up. Whether they activated. Whether they came back. How much revenue they've brought. Whether they're still paying you right now. One connected view, from the click all the way to a paying customer, for every person who ever entered through an ad.
The pipeline exists so that you can stop guessing about what happens after the click.
The part that stings: cheap signups aren't good users
The channel your ad manager is proudest of, the one with the lowest cost per signup, the one everyone points at in the weekly meeting, might be your worst channel. And you'd never know it from the ad dashboard, because the dashboard stops looking exactly at the moment the story gets interesting.
These numbers are illustrative, made up to show the shape of the thing, but the shape is real and I see it constantly.
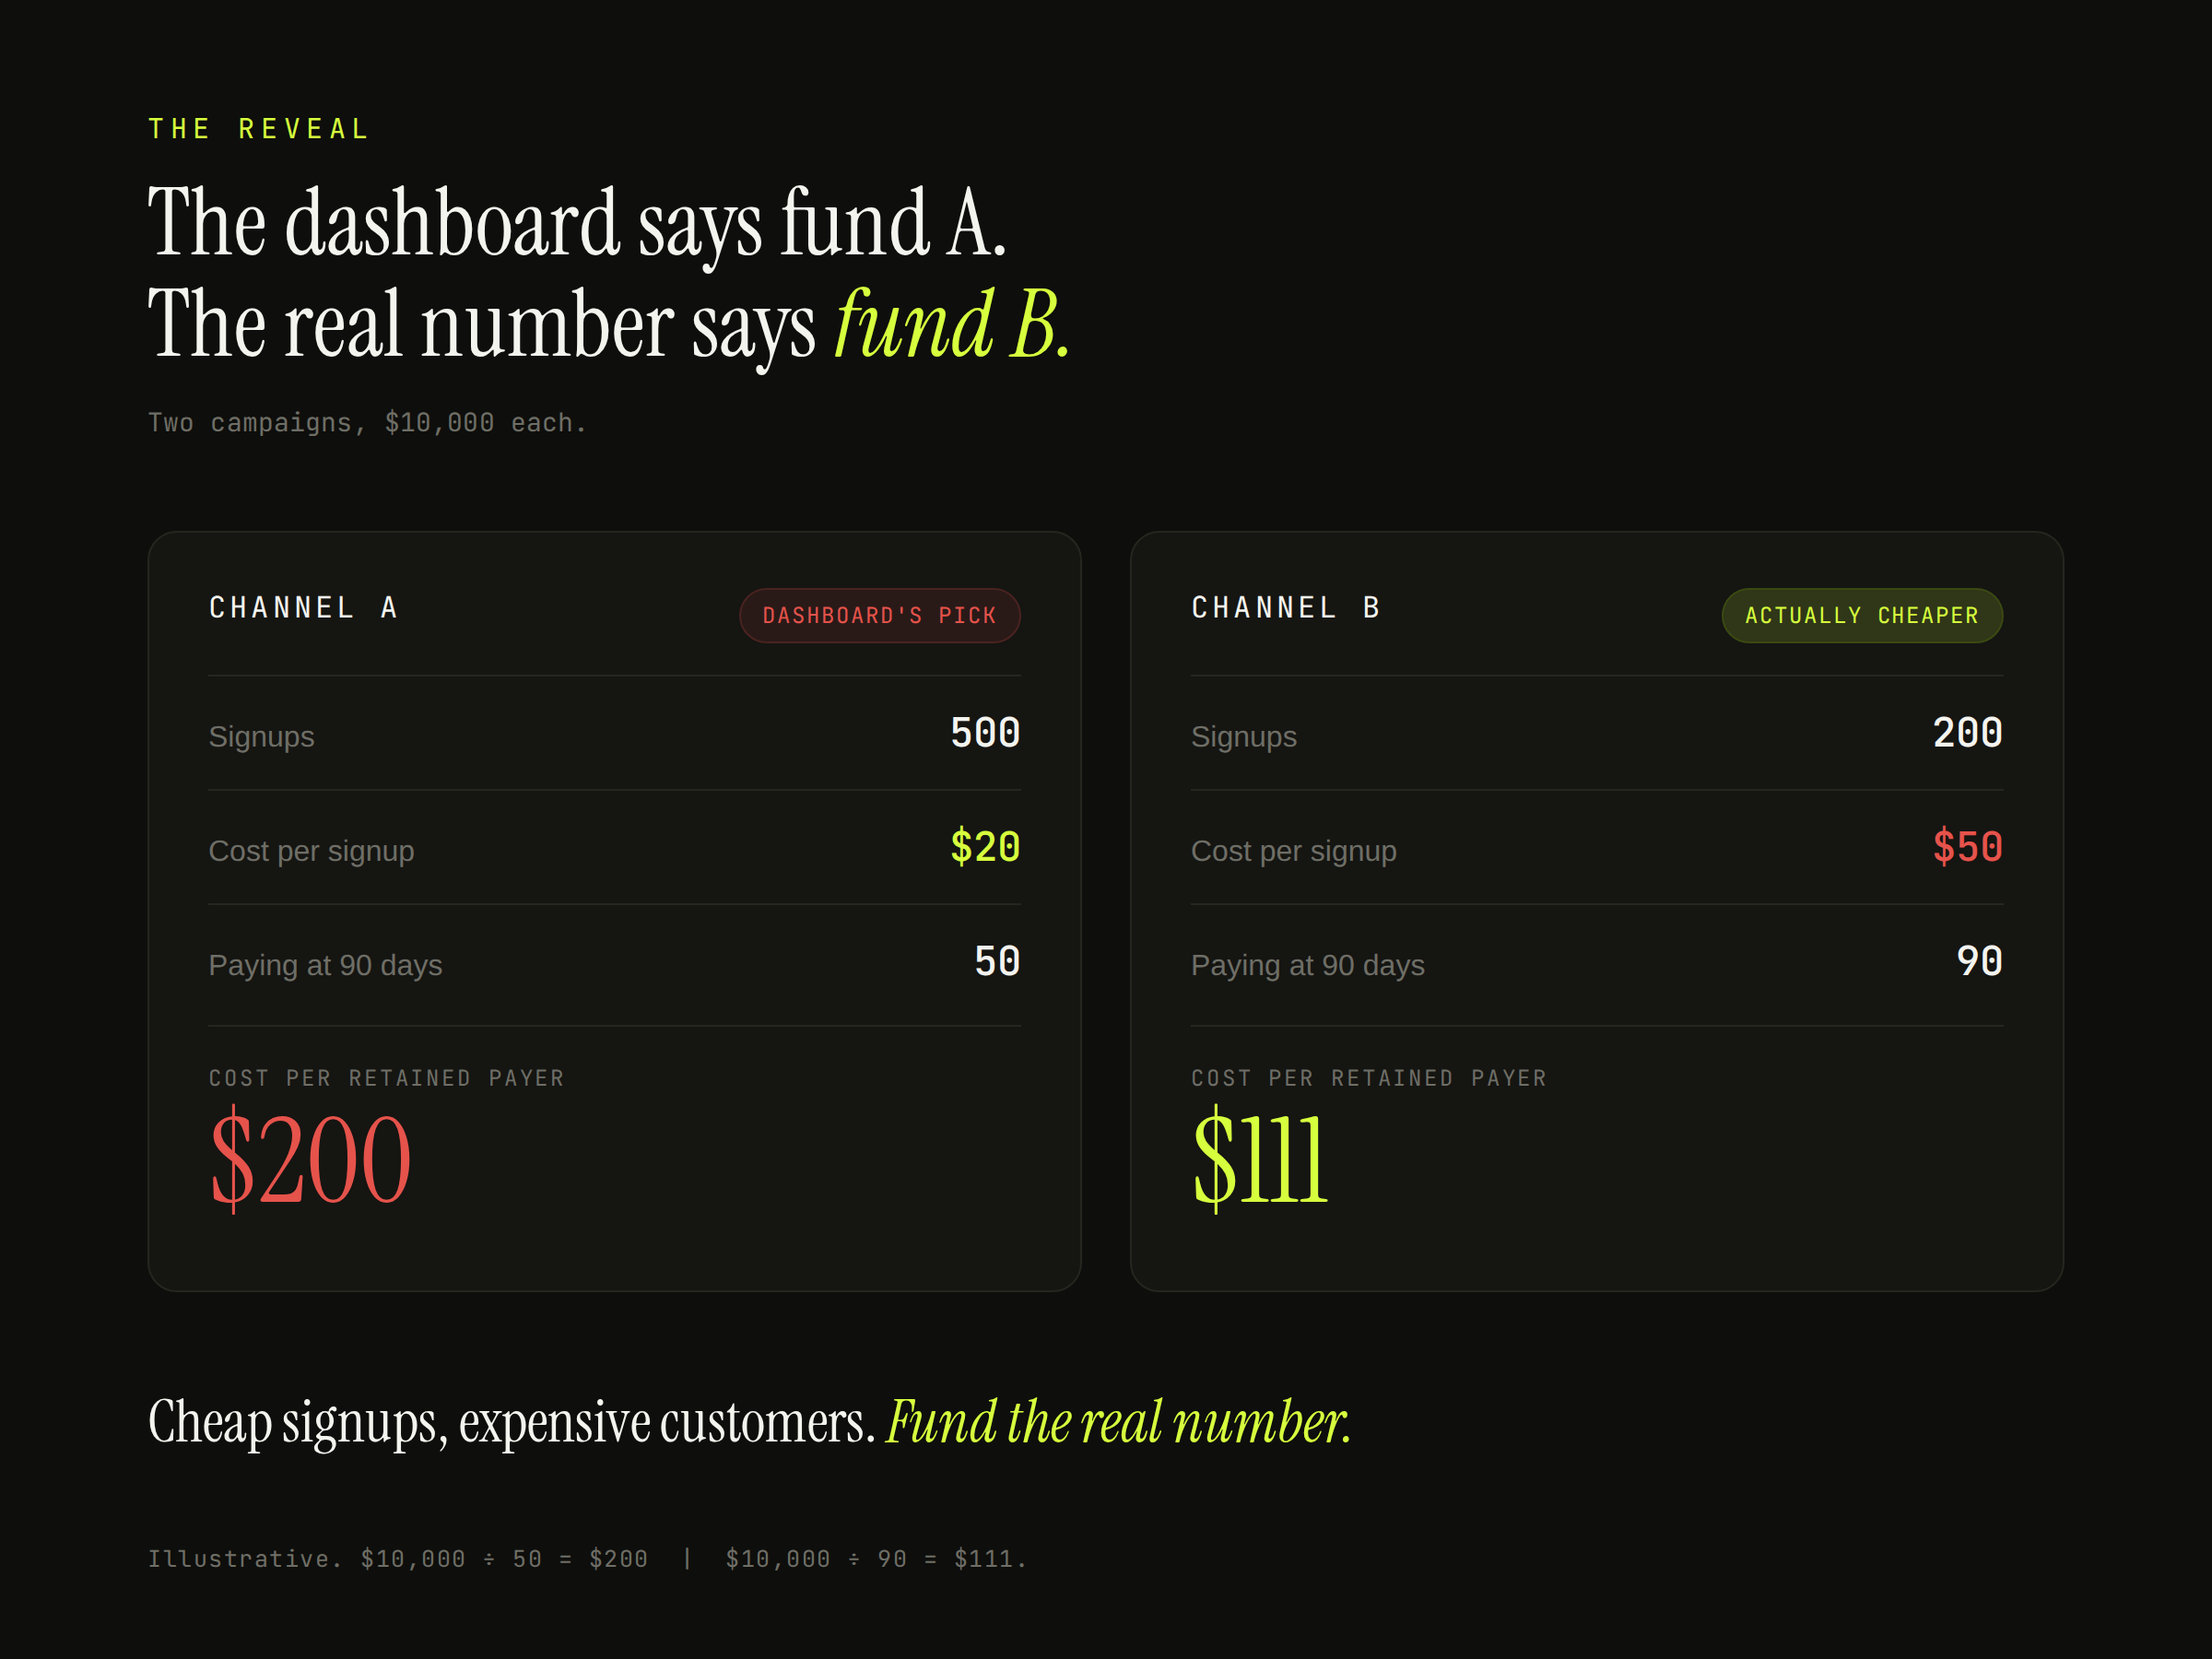
Say you're running two campaigns. Channel A and Channel B. Same budget, ten thousand dollars each.
On the ad dashboard, Channel A looks like the clear winner. It brought in 500 signups at twenty dollars each. Channel B looks weak, only 200 signups at fifty dollars each. If that's all you can see, the call is obvious. Cut B, pour everything into A.
Now you connect the full picture, and it flips.
Of Channel A's 500 signups, 10 percent are still active and paying after ninety days. That's 50 retained payers, from ten thousand dollars, so two hundred dollars per real customer. Of Channel B's 200 signups, 45 percent are still active and paying. That's 90 retained payers, from the same ten thousand dollars, so about a hundred and eleven dollars per real customer.
Channel B, the one the dashboard told you to kill, brings customers who actually stay at nearly half the true cost. The ad dashboard would have had you double down on the channel that fills your signup count with people who never come back.
Cost per signup is a vanity number. It measures how cheaply you can get someone to leave an email address. Cost per retained paying user is the real one, because it measures how cheaply you can get an actual customer, and that's the only thing your budget is really buying.
If you're now wondering which of your channels is secretly Channel A, that's the exact question I help growth teams answer. Book a free call and we'll figure out what your channels are really costing you.
If you're now wondering which of your channels is secretly Channel A, that's the exact question I help growth teams answer. Book a call and we'll figure out what your channels are really costing you.
What this actually unlocks
Real CAC and payback, per channel. Not cost per signup. Cost per retained paying user, and how many months until that customer's revenue pays back what you spent to acquire them. That payback number is the one that decides whether a channel is fundable or a slow leak, and you simply cannot compute it until revenue and spend live in the same place.
Reallocation you can defend. Move budget toward the channels that bring users who stay and pay, and away from the ones that just bring cheap signups. Not on a hunch, and not because someone likes how the Meta dashboard looks this week. Because you can see the retained-payer economics per channel and point at them.
Killing or fixing the flatterers. Every campaign you were funding purely because the platform said it "converted" is now up for review. Some you kill outright. Some you dig into, fix the targeting or the landing page, and rescue. Either way, you're deciding with the full picture instead of the platform's self-graded report card.
All of them fall out the moment the data is connected. That's the trade you're making: a chunk of unglamorous plumbing work now, in exchange for every budget decision after this being grounded in what customers are actually worth.
Your numbers won't match the platforms, and that's fine
One thing to brace for. Once your own tool is running, its numbers won't agree with Google's or Meta's or TikTok's. You'll see a real gap, and chasing it is a waste of your life.
Two reasons it happens. First, every platform credits itself. Meta wants to believe Meta drove the conversion; Google wants to believe Google did. Run both and they'll happily claim the same customer, which is why your platform numbers added together are usually bigger than reality. Second, they count on different rules. Meta's default attributes a conversion on a 7-day click plus a 1-day view, and that view-through piece, crediting an ad someone merely saw and never clicked, is a conversion your product tool has no way to see and mostly shouldn't count. The numbers were never going to tie out.
The upside of owning your own tool is that you get to choose the attribution model instead of accepting whatever the ad platform imposes. First touch, last touch, linear, position-based, whatever fits how you actually think about the journey. The platform gives you its model and its verdict. Your tool gives you the choice.
If your own tracking is solid, trust your own numbers for decisions and let the platforms disagree. They're measuring to flatter themselves. You're measuring to run a business.
The honest limit
I'm not going to tell you this gives you a perfect god-view, because it doesn't, and anyone who tells you otherwise is selling something.
UTM-based attribution works well wherever there's a click you can tag. That covers most of your paid traffic. What it doesn't fully capture is view-through, someone who saw an ad, didn't click, and showed up later, and some slice of iOS and privacy-protected traffic where the click just can't be tied back to a person. If you want to go deeper on why some of this comes down to how you're capturing events in the first place, the tradeoffs between client-side, proxy, and server-side tracking are worth understanding, and I've written about that separately.
The choice isn't between this and perfection. It's between this and flying on ad-platform numbers alone, which is what you're doing right now. Connecting your own data gets you from "the platforms told me so" to a view you actually control, with honest and knowable gaps at the edges. That's the difference between guessing and knowing, minus a rounding error you're aware of.
This is the loop I close for growth teams: get off the platform's self-graded numbers and onto a view of what customers are actually worth. If that's where you're stuck, book a free call and I'll help you see past the click.
This is the loop I close for growth teams: get off the platform's self-graded numbers and onto a view of what customers are actually worth. If that's where you're stuck, book a call and I'll help you see past the click.
Where this goes
Get off GA4 and onto a real product tool. Connect your ad data and your revenue data into it alongside your product events. Match your UTM campaign names to your ad platform campaign names exactly, because that boring rule is load-bearing. And then actually use it: compute real CAC and payback per channel, move budget toward users who stay and pay, and kill the campaigns that only ever looked good because the platform was grading its own work.
Do that and you stop optimizing to the cheapest click and start optimizing to the customer.
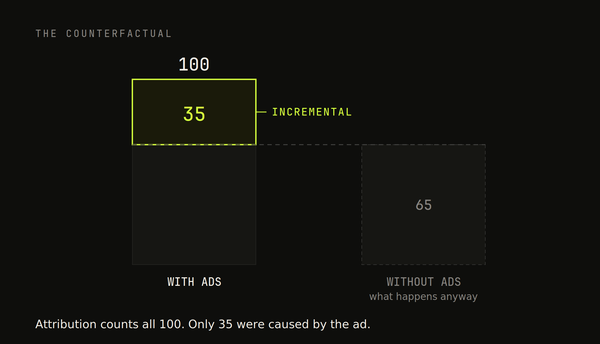
There's a ceiling to this, worth naming so you know it's coming. Per-user attribution is powerful, but once your budgets get large enough, it stops being the whole answer. When you're spending real money across many channels at once, you start needing to measure whether a channel is actually causing incremental revenue or just taking credit for demand that already existed, and that's a different set of tools, incrementality testing and marketing mix modeling. That's the next problem, and it's a good problem, because it means the ads are working. But you don't get to have that problem until you can first see past the click.
Want this on your own stack?
Datalyze rebuilds your data foundation, then finds the growth it's been hiding — proven across 150+ startups.
Book a free analytics audit →